The Effect of Temperature on the Rate of a Reaction
A focused revision guide to the effect of temperature on rate for Cambridge International A Level Chemistry: timing the peroxodisulfate–iodide clock at five temperatures, turning each time into a relative rate, reading the trend, explaining it with the Boltzmann distribution and evaluating the errors.
The Effect of Temperature on Rate: the 1/t Curve
Time the iodine clock at five temperatures, turn each time into 1/t, plot it against temperature and explain the curve with the Boltzmann distribution.
© Dr. Mohammed Al-Fatah – onlinelearningsystem.net
Recap: Rates, Temperature and Kelvin
Three quick questions on the ideas this practical builds on: why temperature changes rate, converting to kelvin, and why (1) / (t) measures the rate of a clock reaction.
What This Practical Is Testing
This practical times one reaction at five temperatures and shows how the rate rises with temperature. The reaction is the peroxodisulfate–iodide clock: colourless until a sudden blue-black colour appears.
S₂O₈²⁻(aq) + 2I⁻(aq) → 2SO₄²⁻(aq) + I₂(aq)
I₂(aq) + 2S₂O₃²⁻(aq) → 2I⁻(aq) + S₄O₆²⁻(aq)
The clock idea is the one used in Following Reaction Rates: a small fixed amount of thiosulfate removes the iodine as it forms, and starch turns blue-black when the thiosulfate runs out.
The same amount of iodine forms every run, so rate ∝ (1) / (t).
On the Cambridge International course this practical is examined through Paper 5, which assesses planning, analysis and evaluation of practical work, and Paper 3 for the laboratory skills.
The syllabus references are 8.2 (the effect of temperature on rate, explained with the Boltzmann distribution) and 26.1.6 (the qualitative effect of temperature on the rate constant) in the Cambridge 9701 syllabus.
Questions ask you to calculate (1) / (t) for each run, plot it against temperature, describe the trend and explain it with the Boltzmann distribution, then evaluate the timing and temperature errors.
Key idea: rate ∝ (1) / (t). As the temperature rises, (1) / (t) rises more and more steeply: here the rate roughly doubles for every 10 °C rise, because a greater fraction of collisions have energy of at least Eₐ.
Safety and Apparatus
The apparatus is simple; the marks are for using it so that every run is at a known, steady temperature and times the same amount of iodine.
| Item | What it is for | Precision or note |
|---|---|---|
| Thermostatic water bath (or a beaker of water on a tripod) | Brings both solutions to the chosen temperature and holds the mixture there during the run | set between 20 and 60 °C; read the thermometer, not the dial |
| Thermometer (−10 to 110 °C) | Temperature of the mixture at the colour change | ±0.5 °C per reading |
| Two boiling tubes | Hold the iodide mixture and the peroxodisulfate separately while they warm | same tubes every run |
| Two 10 cm³ measuring cylinders | Measure 10.0 cm³ of KI(aq) and 10.0 cm³ of K₂S₂O₈(aq) | ±0.1 cm³ |
| 5 cm³ graduated pipette (or a burette) | Measures 5.0 cm³ of 0.0100 mol dm⁻³ Na₂S₂O₃(aq) | this volume fixes the amount of iodine timed, so it must be identical every run |
| Dropping pipette | Adds about 2 cm³ of starch solution | amount not critical |
| Digital stopwatch | Time from mixing to the first blue-black colour | reads to 0.01 s; the end point is judged to about ±1 s |
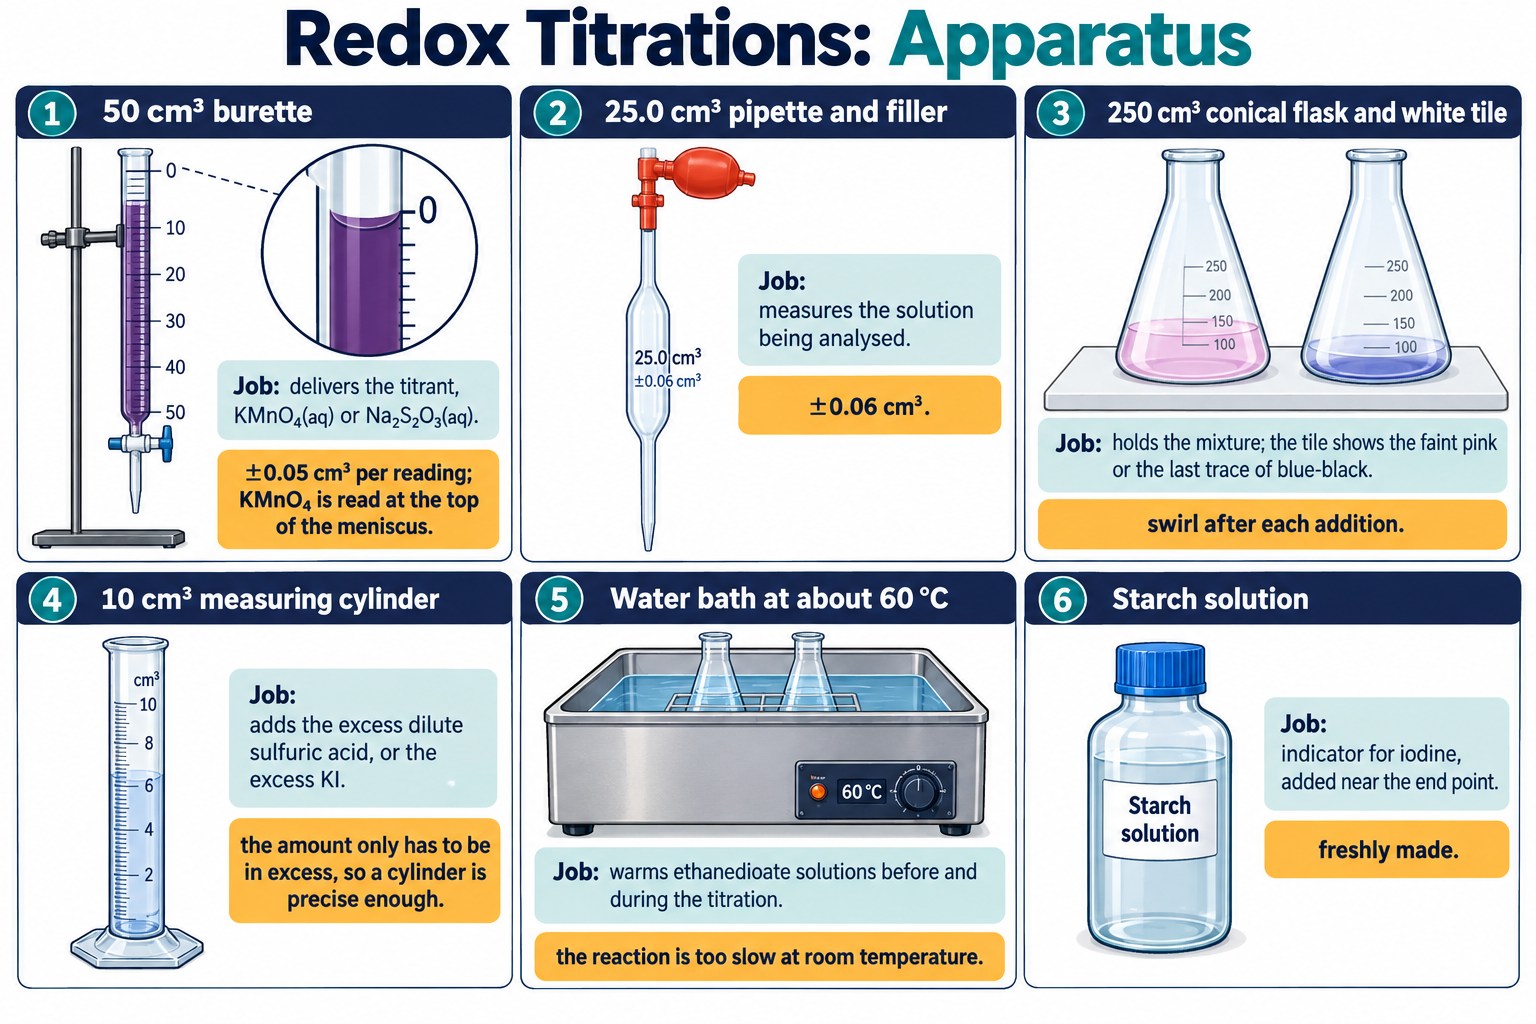
The redox titration apparatus: burette, pipette and filler, conical flasks on a white tile, a 10 cm³ measuring cylinder, a water bath and starch solution. This clock practical uses the cylinder, water bath and starch, plus boiling tubes, a thermometer and a stopwatch.
Safety: Potassium peroxodisulfate is an oxidising agent and a skin and respiratory sensitiser: avoid the dust, wear gloves and eye protection. The iodine formed is a low hazard here. Keep the bath below about 60 °C and lift hot tubes with a holder.
Method: Step by Step
Each run uses fresh solutions. The two solutions are warmed apart and mixed in the bath, so the reaction starts at the moment the clock starts and runs at the recorded temperature.
| Step | What you do | Why |
|---|---|---|
| Make up the iodide tube | Put 10.0 cm³ of 0.100 mol dm⁻³ KI(aq), 5.0 cm³ of 0.0100 mol dm⁻³ Na₂S₂O₃(aq) and 2 cm³ of starch in a boiling tube. | The thiosulfate removes the first iodine formed; starch shows the moment free iodine appears. |
| Measure the peroxodisulfate | Put 10.0 cm³ of 0.0400 mol dm⁻³ K₂S₂O₈(aq) in a second boiling tube. | Kept apart until both are at temperature: the reaction must not start early. |
| Warm both tubes | Stand both tubes in the water bath at 20 °C until a thermometer in the iodide tube reads steadily. | Both solutions must be at the bath temperature, or the mixture is cooler than you record. |
| Mix and start the clock | Pour the peroxodisulfate into the iodide tube, start the stopwatch, mix once and return the tube to the bath. | Timing starts when the reaction starts; the bath holds the temperature during the run. |
| Watch for the colour | Stop the stopwatch at the first blue-black colour and record t to the nearest second. | The end point is sudden, but judging it still carries about ±1 s. |
| Record the temperature | Read the thermometer in the mixture at the colour change and record it. | The temperature of the reacting mixture, not the bath setting, is the value you plot. |
| Repeat at four more temperatures | Repeat with fresh solutions at about 30, 40, 50 and 60 °C. | Five points spread over 40 °C show the shape of the curve; repeats reduce random error. |
| Process the results | Calculate (1) / (t) for each run, the relative rate. | The same amount of iodine forms every run, so (1) / (t) is proportional to the rate. |
| Plot and describe | Plot (1) / (t) against temperature, draw a smooth curve of best fit and compare (1) / (t) at each 10 °C step. | The shape of the curve shows how strongly the rate depends on temperature. |
Technique point: Never mix cold solutions and then warm them. The reaction would already be running at an unknown, changing temperature, and the time would belong to no single value of T.
Check: Planning a Temperature Investigation
Order the method for a different reaction investigated in the same way.
Why (1) / (t) Measures the Rate
The 5.0 cm³ of 0.0100 mol dm⁻³ thiosulfate removes a fixed amount of iodine before the colour appears: ½ × 0.0100 × (5.0) / (1000) = 2.50 × 10⁻⁵ mol of I₂, in a total volume of 27 cm³. That is the same in every run.
Δ[I₂] = (2.50 × 10⁻⁵ mol) / (0.0270 dm³) = 9.26 × 10⁻⁴ mol dm⁻³, so rate ≈ (9.26 × 10⁻⁴) / (t)
Only 2.50 × 10⁻⁵ mol of the 4.00 × 10⁻⁴ mol of peroxodisulfate has reacted at the colour change, about 6%, so the concentrations are still close to their starting values and (1) / (t) measures the initial rate.
rate = k[S₂O₈²⁻][I⁻]; the starting concentrations are identical in every run, so rate ∝ k, and k ∝ (1) / (t)
Why temperature changes k
Raising the temperature increases the rate constant, not the concentrations. The Boltzmann distribution shows why: a higher temperature flattens the curve and shifts it to higher energy, so the fraction of collisions with energy at least Eₐ grows steeply.
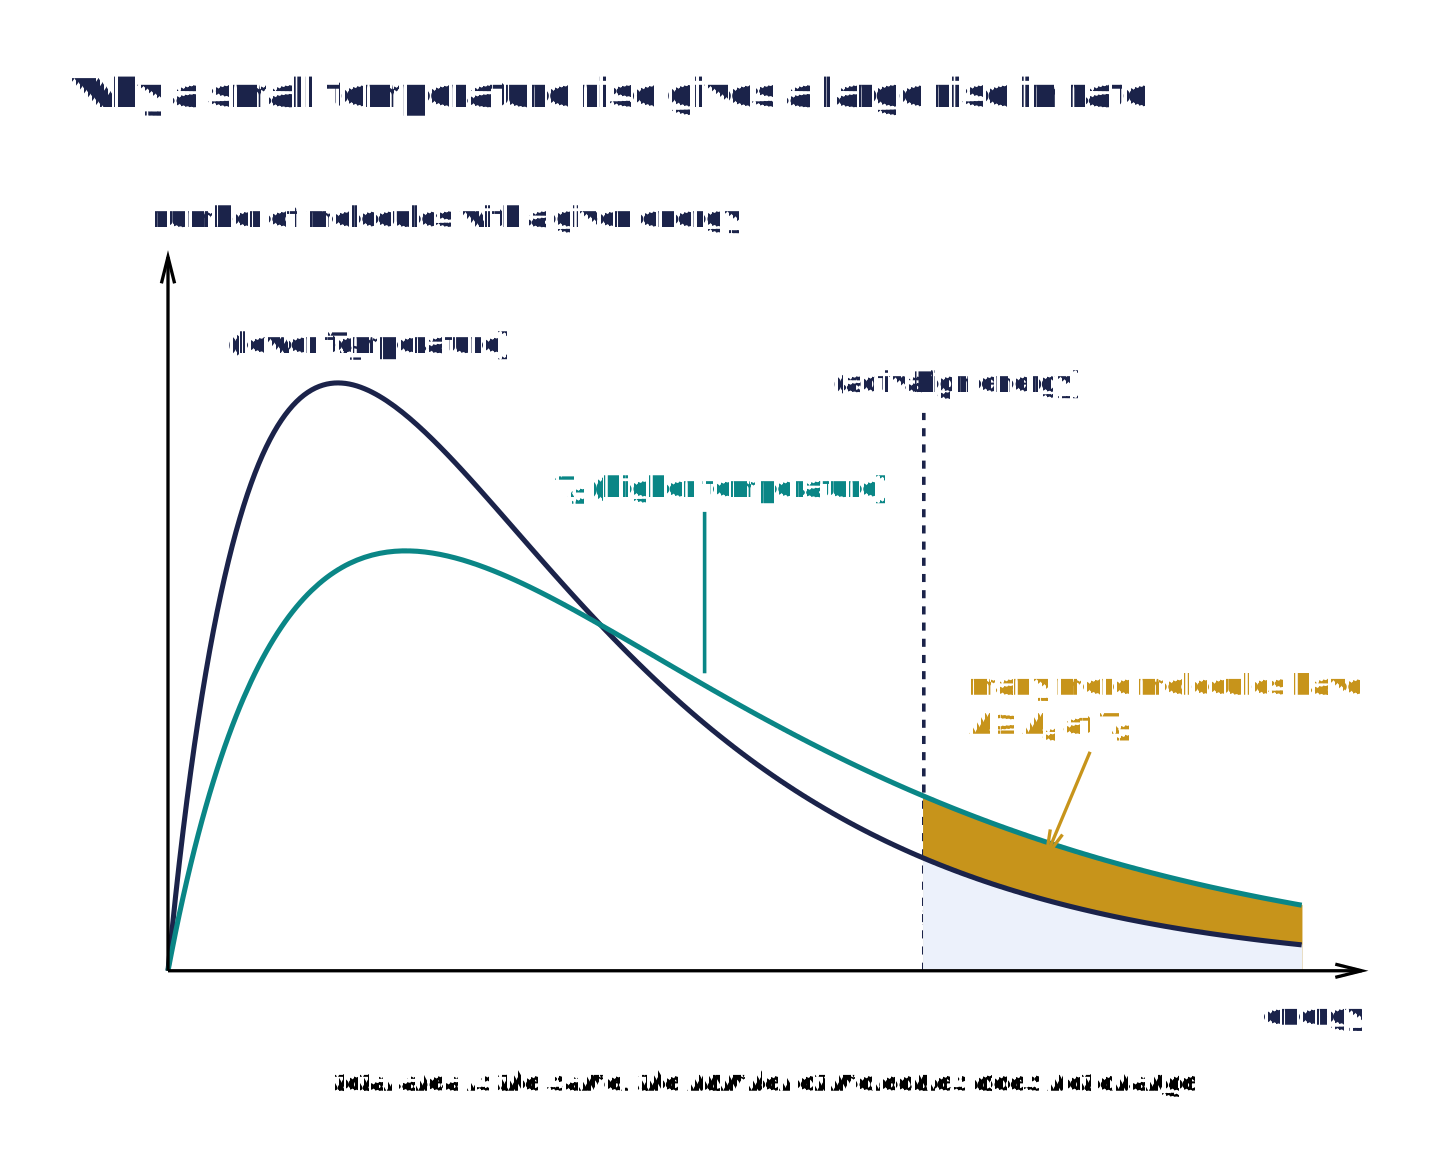
The Boltzmann distribution at two temperatures: at the higher temperature a far larger share of the molecules has energy at least equal to Eₐ, which is why a 10 °C rise can double k.
Exam wording: “The same amount of iodine forms in every run and the starting concentrations are the same, so (1) / (t) is proportional to the rate, and to the rate constant at that temperature.”
Check: Temperature and the Boltzmann Distribution
Drag the words into a description of what heating does to the Boltzmann distribution and to the rate constant.
Results and Processing
The table gives a complete set of results. Times are recorded to the nearest second, the precision of the end point, and (1) / (t) is given to three significant figures.
| T / °C | t / s | (1) / (t) / s⁻¹ | rate relative to 20 °C |
|---|---|---|---|
| 20 | 120 | 8.33 × 10⁻³ | 1.00 |
| 30 | 62 | 1.61 × 10⁻² | 1.94 |
| 40 | 34 | 2.94 × 10⁻² | 3.53 |
| 50 | 19 | 5.26 × 10⁻² | 6.32 |
| 60 | 11 | 9.09 × 10⁻² | 10.9 |
Step 1: (1) / (t) = (1) / (120) = 8.33 × 10⁻³ s⁻¹
Step 2: rate at 30 °C relative to 20 °C = (120) / (62) = 1.94
Each 10 °C step multiplies the rate by about 1.7 to 1.9: 120 s to 62 s is ×1.94, 62 s to 34 s ×1.82, 34 s to 19 s ×1.79 and 19 s to 11 s ×1.73.
Over the 40 °C range the rate rises almost elevenfold, although the temperature in kelvin rises by only 14%.
Significant figures: Keep (1) / (t) to three significant figures and record each time to the nearest second. Rounding 11 s to 10 s would change the hottest value of (1) / (t) by 10%.
Check: Processing a New Data Set
Take reciprocals, compare relative rates and recover a time from (1) / (t) for a different clock reaction.
Reading the Graph
Plot (1) / (t) on the y-axis against temperature on the x-axis. The points do not lie on a straight line: they lie on a curve that gets steeper as the temperature rises.
A straight line would mean the rate rose by the same amount for every 10 °C. Instead it rises by roughly the same factor, about two each time, so each step adds more than the last.
The Boltzmann distribution explains this: each 10 °C rise multiplies the fraction of particles with E ≥ Eₐ by a similar factor, so the frequency of effective collisions, and k, grow faster and faster.
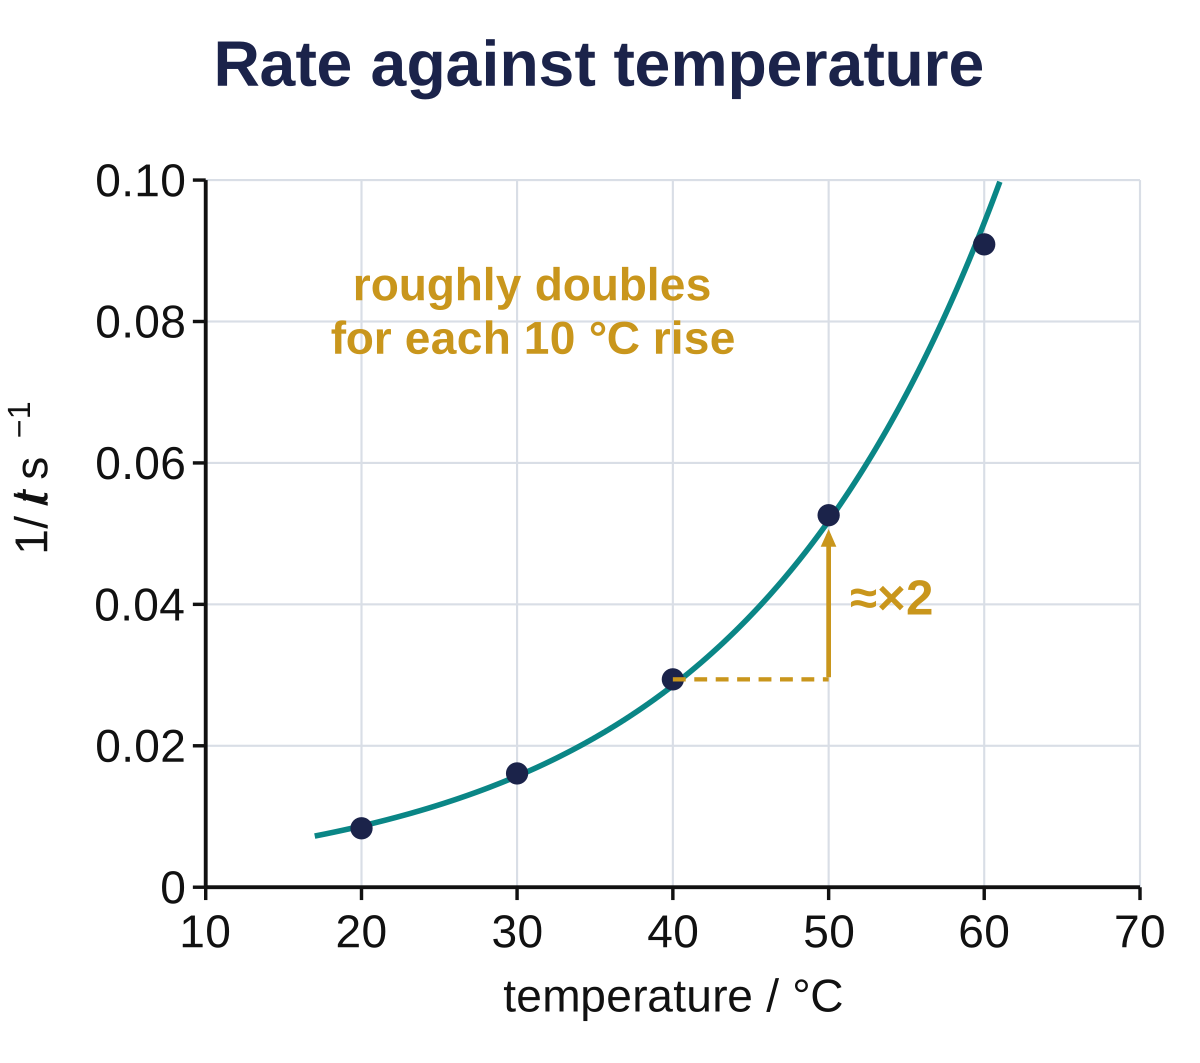
The relative rate, 1/t, against temperature for the five runs: a curve that gets steeper as the temperature rises, with 1/t roughly doubling for each 10 °C.
A catalyst on the same graph
A catalyst gives a route with a lower Eₐ, so a larger fraction of collisions are effective at every temperature. Its curve of (1) / (t) against temperature lies above the uncatalysed curve at every temperature.
Exam wording: “The rate increases with temperature, roughly doubling for each 10 °C rise, because a greater proportion of collisions have energy greater than or equal to Eₐ.”
Check: Temperature, k and Catalysts
Work out relative rates, explain the rise in k and tell a temperature change from a catalyst, all on new reactions.
Beyond the Syllabus: the Arrhenius Plot
Extension: beyond the Cambridge syllabus
The 9701 syllabus asks for the qualitative effect of temperature on rate and on the rate constant only. The Arrhenius equation and the activation-energy calculation below are not in the syllabus.
k = Ae−Ea/RT, so ln k = (−Eₐ) / (R) × (1) / (T) + ln A
With T in kelvin, a graph of ln k against (1) / (T) is a straight line of gradient (−Eₐ) / (R). Because (1) / (t) ∝ k here, ln((1) / (t)) can be plotted in place of ln k: only the intercept changes.
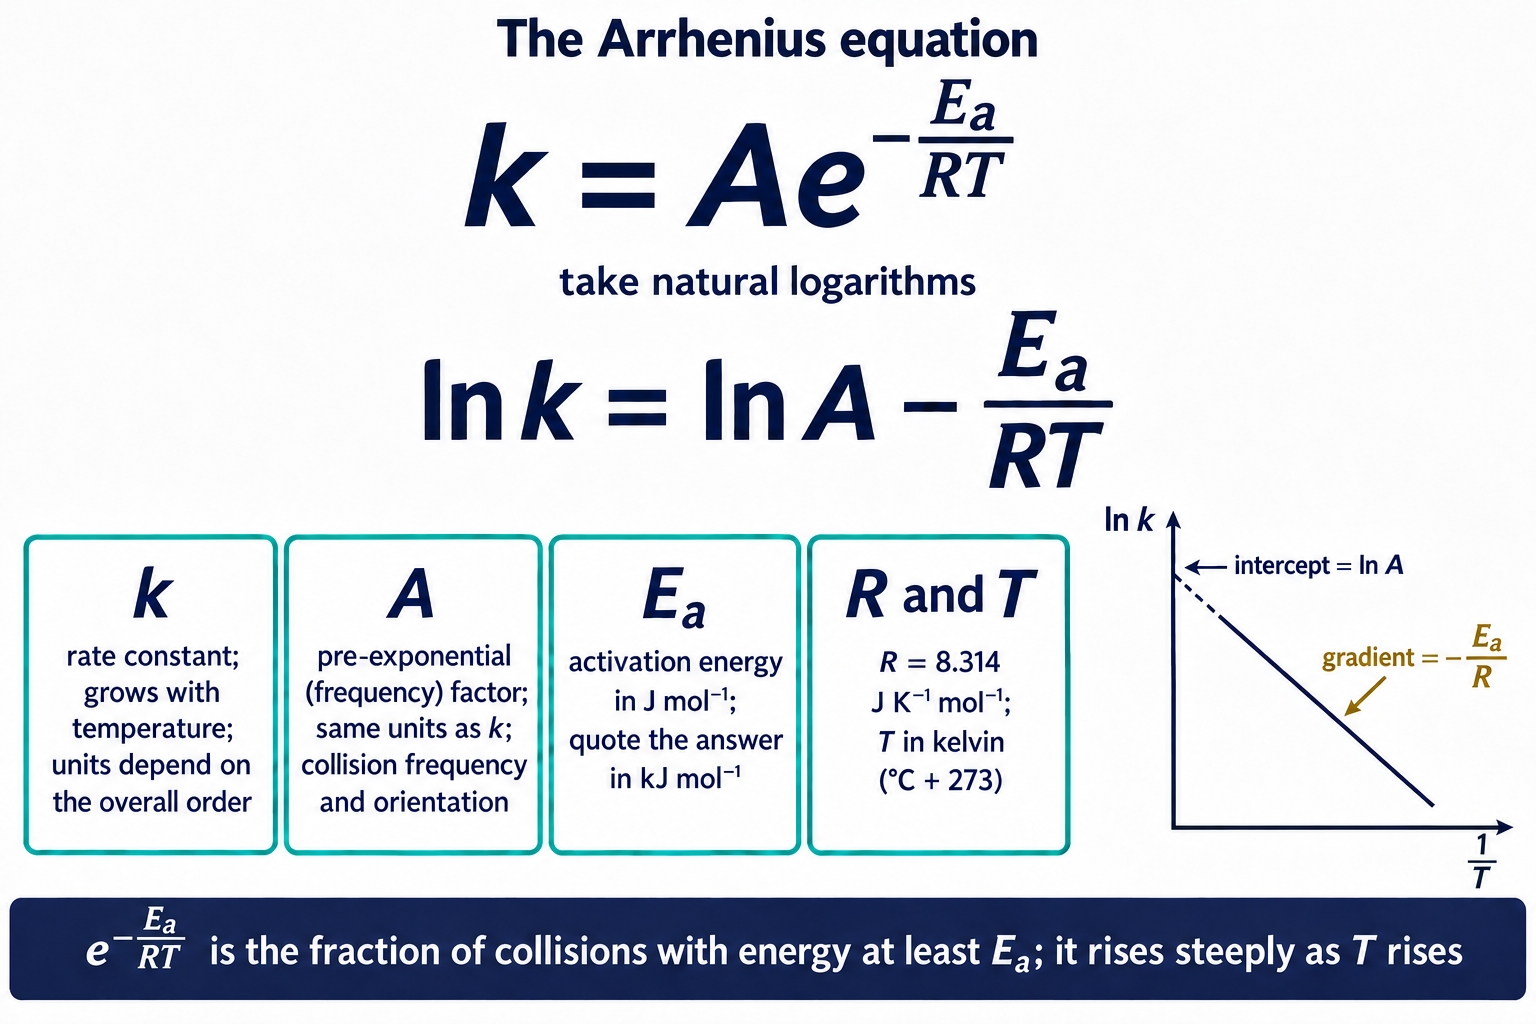
The Arrhenius equation in both forms, what k, A, Eₐ, R and T mean, and the straight-line plot with gradient (−Eₐ) / (R) and intercept ln A.
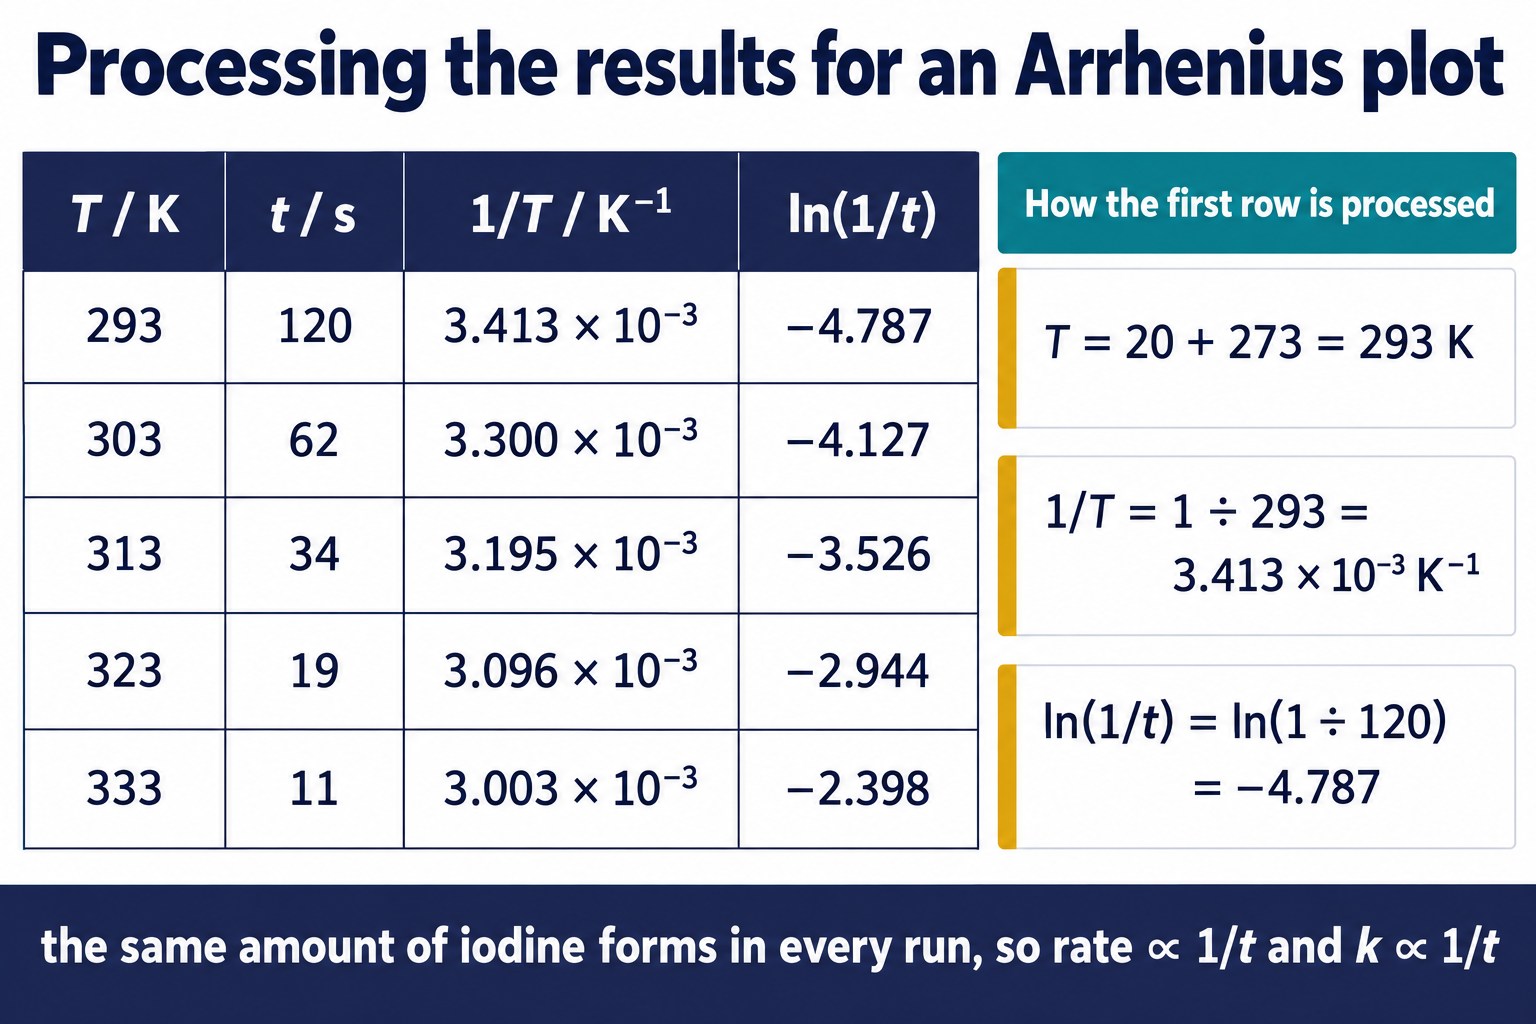
The five runs processed for the Arrhenius plot: T in kelvin, the time to the colour change, (1) / (T) and ln((1) / (t)), with the working for the first row.
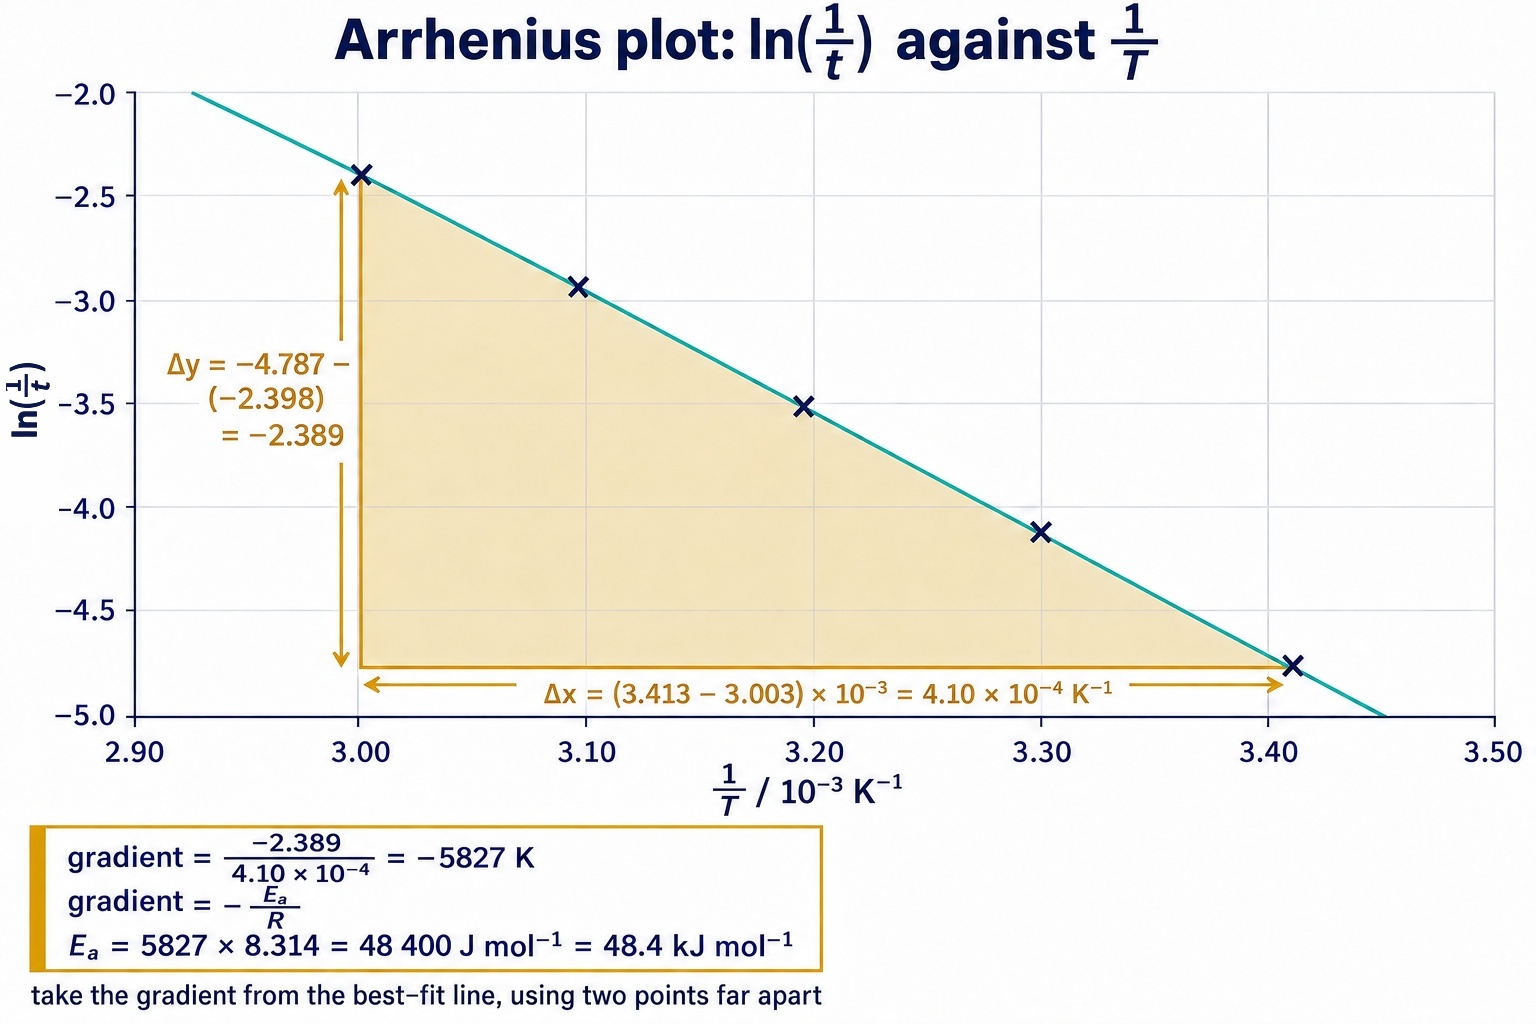
The Arrhenius plot of ln((1) / (t)) against (1) / (T) for the five runs: a straight line of gradient −5827 K, giving Eₐ = 48.4 kJ mol⁻¹.
gradient = (−4.787 − (−2.398)) / (3.413 × 10⁻³ − 3.003 × 10⁻³) = −5827 K
Eₐ = −gradient × R = 5827 × 8.314 = 48 400 J mol⁻¹ = 48.4 kJ mol⁻¹
Textbook values for the peroxodisulfate–iodide reaction lie close to 50 kJ mol⁻¹, so the result agrees within the uncertainty of the timing.
Other Reactions You Can Use
Any reaction that can be timed to a fixed end point at several temperatures can be used in the same way. Examiners describe one of these and ask you to process the data in the same way.
Thiosulfate and acid. S₂O₃²⁻(aq) + 2H⁺(aq) → S(s) + SO₂(g) + H₂O(l); time for a pencil cross under the flask to disappear behind the sulfur. Simple, but SO₂ is toxic, so keep below about 60 °C.
Magnesium and acid. Mg(s) + 2H⁺(aq) → Mg²⁺(aq) + H₂(g); time to collect a fixed volume of hydrogen, or for a measured ribbon to disappear. Clean the ribbon with emery paper every run.
Manganate(VII) and ethanedioate. 2MnO₄⁻(aq) + 5C₂O₄²⁻(aq) + 16H⁺(aq) → 2Mn²⁺(aq) + 10CO₂(g) + 8H₂O(l); time for the purple colour to disappear. Watch for autocatalysis by Mn²⁺, which makes the later part of each run faster.
In every version the rule is the same: the same amount of change must be timed in every run, so that (1) / (t) is proportional to the rate constant at that temperature.
Choosing a reaction: Pick one whose times fall between about 30 s and 3 minutes across your temperature range: short times make the ±1 s timing error large, and long runs lose heat and drift in temperature.
Planning the Investigation
A planning question asks you to design this experiment from a short brief. The marks go to the variables, the method of fixing the end point, the range, the processing and the safety, each stated explicitly.
Independent variable. The temperature of the mixture, five values spread over at least 40 °C, measured with a thermometer in the mixture, not the bath setting.
Dependent variable. The time to a fixed observation (the blue-black colour), recorded to the nearest second and converted to (1) / (t).
Controlled variables. The volumes and concentrations of every solution, especially the thiosulfate that fixes the amount of iodine timed; the same tubes; the same observer and background.
Processing. A table with columns for T / °C, t / s and (1) / (t) / s⁻¹; a graph of (1) / (t) against temperature with a smooth curve of best fit; a statement of how many times the rate rises for each 10 °C.
Safety. Peroxodisulfate is an oxidising agent and a sensitiser: gloves and eye protection. Hot water bath: a tube holder, and no temperature above about 60 °C.
Planning tip: State how you will know the mixture is at temperature (a steady thermometer reading in the tube) and why the two solutions are warmed separately. Both earn marks.
Errors, Uncertainty and Improvements
The stopwatch and thermometer are precise; the errors come from the temperature of the mixture not being what you record and from judging the colour change. Each row says which way the result moves.
| Source of error | Effect on the result | Improvement |
|---|---|---|
| Temperature changes during the run | Plotted T is wrong; points scatter about the curve | Keep the tube in the bath; record start and end temperatures and plot the mean |
| Solutions mixed before they reach the bath temperature | Reaction runs cooler than recorded: t too long, point below the curve | Wait until the thermometer in the tube reads steadily before mixing |
| Judging the first blue-black colour | Random ±1 s; largest effect on the fastest run | Same observer, white background; or a light sensor and data logger |
| Fastest run too short (11 s at 60 °C) | ±1 s is 9.1% of the time | Use more dilute peroxodisulfate or a larger volume so every run takes over 30 s |
| Thiosulfate volume varies between runs | Different amount of iodine timed, so (1) / (t) is no longer ∝ rate | Measure the 5.0 cm³ with a graduated pipette or burette, not a dropper |
| Only five temperatures and no repeats | One scattered point changes the shape of the curve | More temperatures across the range and repeats at each |
Percentage uncertainties. Timing to ±1 s: on the 60 °C run, (1) / (11) × 100 = 9.1%; on the 20 °C run, (1) / (120) × 100 = 0.83%.
The thermometer, ±0.5 °C on 293 K, contributes only (0.5) / (293) × 100 = 0.17%.
So the hottest run is the weakest point on the graph, and timing, not temperature, limits the result: its (1) / (t) carries a 9.1% uncertainty, visibly more than the scatter of the other points.
Exam focus: Say which way each error moves the point: “a time that is too short gives too large a value of (1) / (t), so the hottest point sits above the curve and the rate seems to rise faster than it really does”.
Check: Evaluating the Experiment
Choose the correct statement about uncertainty, temperature, the curve of best fit, improvements and the shape of the graph.
Common Mistakes
The same slips cost marks every year. Each line gives the mistake and the correction that earns the mark.
Plotting t. Plotting the time instead of (1) / (t); that graph falls as the temperature rises. Plot (1) / (t), the relative rate.
A straight line. Forcing a straight line through points that lie on a curve. Draw a smooth curve of best fit.
Two runs only. Describing the trend from the first and last runs. Use every run and compare each 10 °C step.
Rounding early. Rounding (1) / (t) to one significant figure, which hides the differences between runs.
Bath temperature. Recording the water-bath setting instead of the temperature of the reacting mixture.
Eₐ falls. Writing that the activation energy falls when the mixture is heated. Eₐ is fixed; a greater fraction of particles reach it.
Collisions only. Explaining the rise only by “particles collide more often”. The main reason is the larger fraction of collisions with E ≥ Eₐ.
Common Exam Points
Say
“Plot (1) / (t) against temperature; the rate is proportional to (1) / (t).” “The same amount of iodine forms every run, so (1) / (t) ∝ rate.” “A greater proportion of collisions have energy ≥ Eₐ, so the frequency of effective collisions increases.”
Do not say
“The rate is proportional to the temperature.” (It roughly doubles every 10 °C.) “The activation energy decreases as the temperature rises.” “The particles collide more often, so the rate doubles.” (The extra collisions are the smaller effect.)
Watch for
Reciprocals to three significant figures; a smooth curve, not a straight line; the factor by which the rate rises for each 10 °C; Boltzmann sketches with equal areas; the point with the largest timing uncertainty.
FAQs
Short answers to the questions students most often ask about temperature and rate.
Why plot (1) / (t) and not t?
Because (1) / (t) is proportional to the rate when the same amount of iodine forms in every run and the starting concentrations are the same. A graph of t falls as the temperature rises and hides how fast the rate grows.
Why is the graph of (1) / (t) against temperature a curve?
Each 10 °C rise multiplies the rate by roughly the same factor, about two here, rather than adding the same amount. Repeated multiplying gives a curve that gets steeper as the temperature rises.
Why does a 10 °C rise roughly double the rate?
A 10 °C rise increases the collision frequency by only about 2%. It increases the fraction of collisions with energy of at least Eₐ far more, which shows as the larger area beyond Eₐ on the Boltzmann distribution.
Why is the run at the highest temperature the least reliable?
The time is shortest there, so the ±1 s needed to judge the colour change is the largest percentage of the reading: 9.1% for an 11 s run against 0.83% for a 120 s run. Using a slower, more dilute mixture fixes this.
What does a catalyst do to these results?
A catalyst gives a route with a lower Eₐ, so every run is faster and every value of (1) / (t) is larger. The curve for the catalysed reaction lies above the uncatalysed curve at every temperature.
Do I need to find the activation energy for Cambridge 9701?
No. The syllabus asks for the qualitative effect of temperature on the rate and on the rate constant. The Arrhenius plot and the activation-energy calculation are in the extension box on this page.
Copyright notice: This OLS revision content, including the explanations, layout, diagrams, tables and embedded learning structure, is authored for Online Learning System by Dr. Mohammed Al-Fatah. It may not be copied, reproduced, redistributed or adapted without written permission.
Keep this note — free
Save your progress across every Cambridge topic. A free account remembers which topics you have covered, saves your question scores, and syncs across your phone and laptop.
- Track every topic you have finished
- Keep your practice-question scores
- No payment, no card, free forever
Already registered? Log in