Thin-Layer Chromatography: Separating and Identifying Compounds
A focused revision guide to Practical Skills: Thin-Layer Chromatography for Cambridge International A Level Chemistry: how a thin-layer chromatography plate is prepared, developed and read, why polar compounds have lower Rf values, a worked amino acid plate with ninhydrin, the purity check of a prepared solid, and the errors that cost marks in evaluation questions.
Thin-Layer Chromatography: Separating and Identifying Amino Acids
Spot three amino acid standards and a mixture on a silica plate, develop it, show the colourless spots with ninhydrin, then measure the Rf values and see why the most polar amino acid moves least.
© Dr. Mohammed Al-Fatah – onlinelearningsystem.net
Recap: Paper Chromatography and Rf
Four quick questions on the GCSE chromatography ideas this practical builds on: mobile and stationary phases, Rf, one spot for a pure substance and the pencil baseline.
What This Practical Is Testing
This practical, Practical Skills: Thin-Layer Chromatography on the Cambridge International course, separates the components of a mixture on a thin-layer chromatography (TLC) plate and identifies them from their Rf values against known compounds run alongside. It is GCSE paper chromatography made precise.
The plate carries a thin layer of a polar solid, silica (SiO₂) or aluminium oxide (alumina), the stationary phase. A solvent, the mobile phase (the eluent), rises through the layer by capillary action and carries the components with it at different speeds.
On the Cambridge International course this practical is examined through Paper 5, which assesses planning, analysis and evaluation of practical work, and Paper 3 for the laboratory skills.
Questions ask you to describe the method with reasons, calculate Rf values from a plate, identify components from standards, explain the order of the spots and evaluate the run.
Key idea: Rf = (distance moved by the spot) / (distance moved by the solvent front). It has no units, lies between 0 and 1, and is compared with standards run on the same plate under the same conditions.
Safety and Apparatus
The apparatus is simple; the care is in the technique. The hazards come from the solvents, the ninhydrin spray and the UV lamp.
| Item | What it is for | Precision or note |
|---|---|---|
| TLC plate (silica or alumina on a backing) | The stationary phase | hold by the edges; fluorescent plates for UV |
| Pencil and ruler | Baseline, solvent front and distances | ruler ±0.5 mm; pencil because ink would run |
| Fine glass capillaries | One per sample: tiny spots | dry and re-spot to concentrate |
| 250 cm³ beaker (or tank) with a lid | The developing chamber | solvent below the baseline |
| Filter paper wick | Saturates the chamber with vapour | stops solvent evaporating from the plate |
| Mobile phase (eluent) | Carries the components up the plate | a polar or non-polar solvent chosen for the mixture |
| UV lamp, ninhydrin spray and oven, or iodine | Makes colourless spots visible | UV: circle the dark spots in pencil |
Safety: Organic solvents are flammable and their vapours harmful: work in a fume cupboard with no flames. Ninhydrin is an irritant: spray in the fume cupboard wearing gloves. UV light damages eyes and skin: wear goggles and never look at the lamp.
Method: Step by Step
The method below runs a mixture of amino acids against three standards, with ninhydrin to show the spots. The same steps apply to any mixture; only the solvent and the way of seeing the spots change.
| Step | What you do | Why |
|---|---|---|
| Baseline | Draw a pencil line 1.0 cm from the bottom of the plate and mark four equally spaced positions on it. | Pencil does not dissolve; ink would run up with the solvent. |
| Spot | Touch a fine capillary of each solution to its position once; let it dry, then re-spot. | Small concentrated spots separate cleanly; large spots streak and overlap. |
| Charge the chamber | Pour the solvent into the beaker to about 0.5 cm, stand a filter paper wick in it and fit the lid. | The wick saturates the air with vapour, so the solvent does not evaporate from the plate. |
| Develop | Lower the plate in with the baseline above the solvent level, replace the lid and leave it undisturbed. | Spots under the solvent would dissolve away; the solvent rises evenly in still, saturated air. |
| Stop and mark | When the front is about 1 cm from the top, remove the plate and mark the front in pencil at once. | The solvent evaporates within seconds; without the front there is no Rf. |
| Dry | Let the plate dry in the fume cupboard. | Removes the solvent vapour safely and leaves dry spots to detect. |
| Visualise | Spray with ninhydrin and warm, or view under UV and circle the dark spots in pencil. | The compounds are colourless; a locating agent or the fluorescent plate shows where they are. |
| Measure | Measure from the baseline to the centre of each spot and to the solvent front; calculate each Rf. | The centre of the spot is the reproducible point; the ratio removes the effect of how far the solvent rose. |
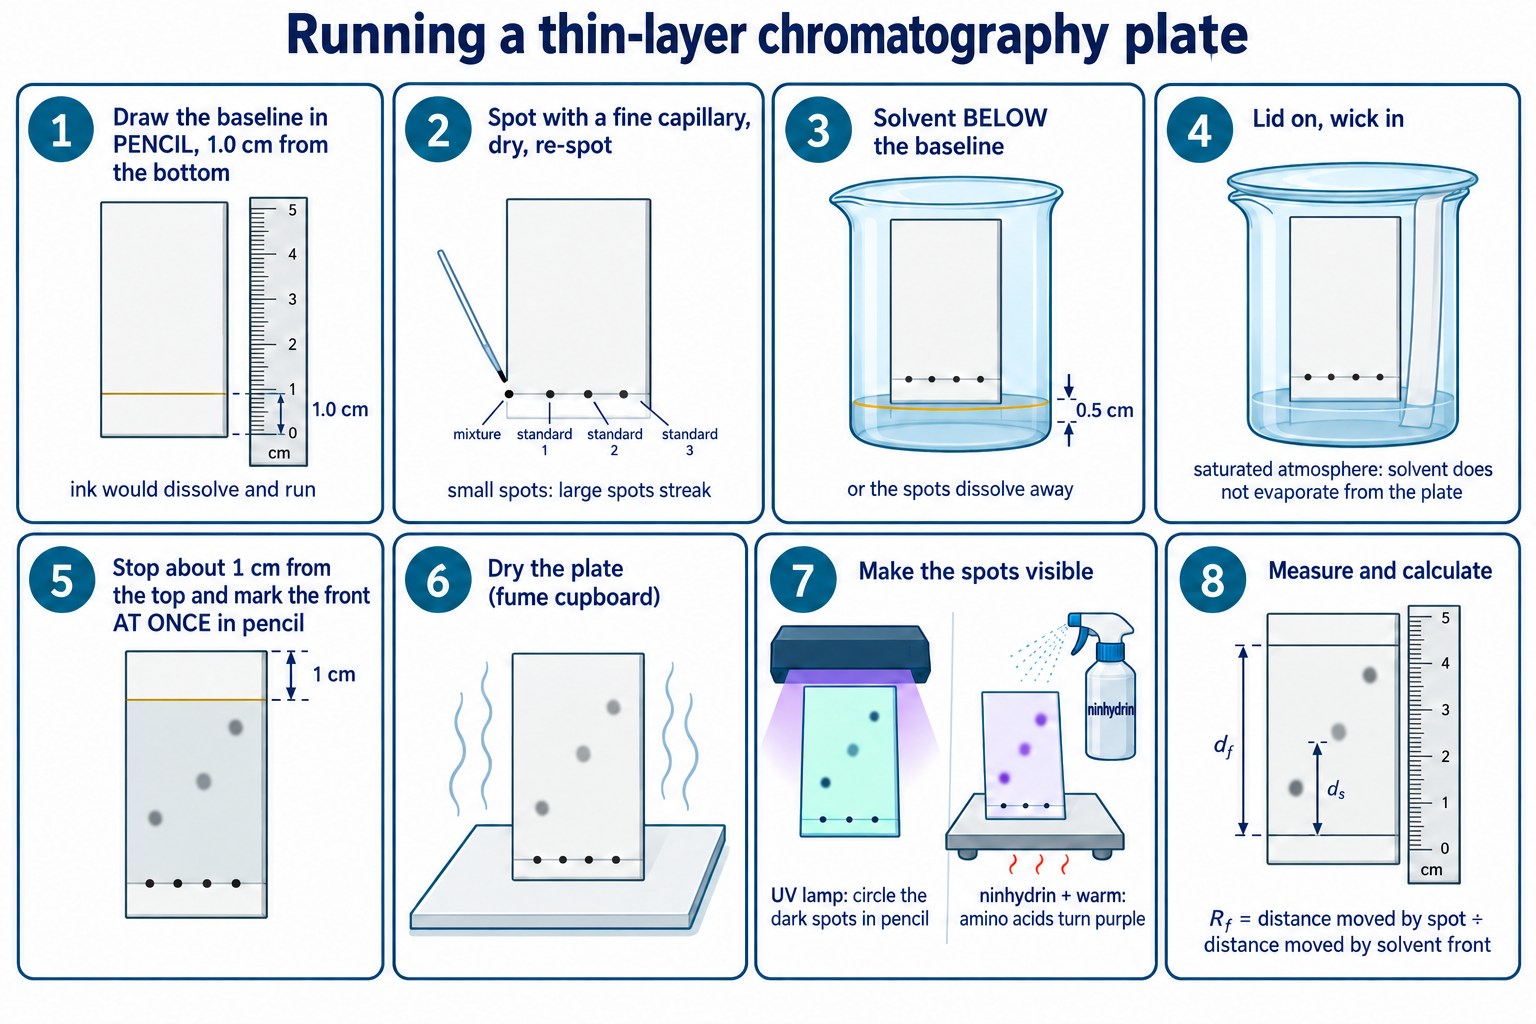
The eight steps of a TLC run: pencil baseline, capillary spotting, solvent below the baseline in a covered beaker with a wick, the front marked at once, drying, visualising and measuring.
Technique point: Hold the plate by its edges, or wear gloves: fingerprints show as dark smudges under UV and can be mistaken for spots.
Check: Identifying the Painkillers in a Tablet
Order the method for a different mixture run against standards under UV.
How the Separation Works
Every component is pulled two ways. It adsorbs to the polar surface of the stationary phase, which is covered in –OH groups that hydrogen bond and attract polar molecules. It also dissolves in the mobile phase, which carries it upward.
Polar molecules adsorb strongly, spend more time held on the surface, and move a short way: low Rf. Less polar molecules adsorb weakly, spend more time in the moving solvent, and travel further: high Rf.
The solvent matters too. A more polar eluent competes with the compounds for the surface and dissolves polar compounds better, so every Rf rises. That is why a value is only meaningful alongside standards run on the same plate.
What Rf depends on. The stationary phase (silica, alumina, the thickness of the layer), the mobile phase, the temperature and how saturated the chamber was. Change any of these and the numbers change; the order of the spots usually does not.
Exam wording: “Separation depends on the balance between adsorption to the stationary phase and solubility in the mobile phase. The more polar compound is adsorbed more strongly, so it moves less far and has a lower Rf.”
Check: How Separation Works
Choose the correct statements about adsorption, solubility and what an Rf value can and cannot tell you.
Worked Example: Three Amino Acids
A mixture X was run against glycine, alanine and leucine on silica, mobile phase butan-1-ol : ethanoic acid : water in the ratio 4 : 1 : 1, and the spots were shown with ninhydrin. The solvent front moved 6.0 cm.
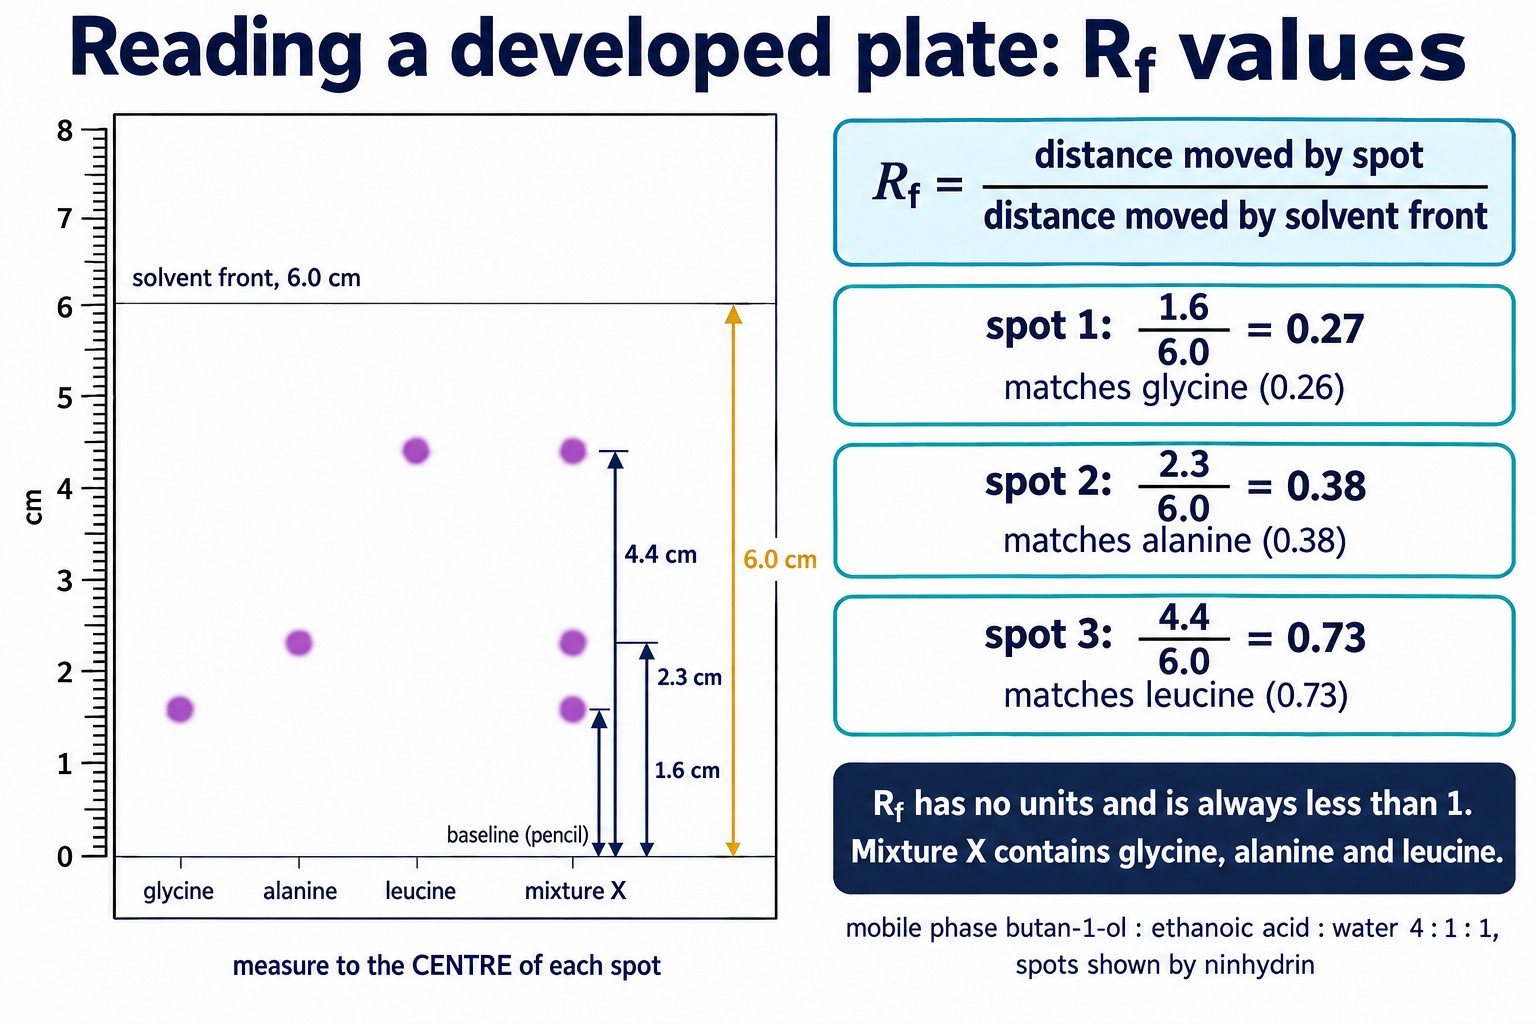
The developed plate: the solvent front at 6.0 cm, spots in the mixture lane at 1.6, 2.3 and 4.4 cm, and the three Rf calculations beside it.
| Spot in lane X | Distance from baseline / cm | Rf | Standard with matching Rf |
|---|---|---|---|
| 1 (lowest) | 1.6 | (1.6) / (6.0) = 0.27 | glycine, 0.26 |
| 2 | 2.3 | (2.3) / (6.0) = 0.38 | alanine, 0.38 |
| 3 (highest) | 4.4 | (4.4) / (6.0) = 0.73 | leucine, 0.73 |
Step 1: measure from the baseline to the centre of each spot, and to the solvent front (6.0 cm)
Step 2: Rf = (distance moved by spot) / (distance moved by solvent front), for example (1.6) / (6.0) = 0.27
Answer: X contains glycine (0.27 against 0.26), alanine (0.38) and leucine (0.73)
Rf values are quoted to two decimal places, which matches a ruler read to the nearest millimetre over a few centimetres. The glycine match of 0.27 against 0.26 is within that precision.
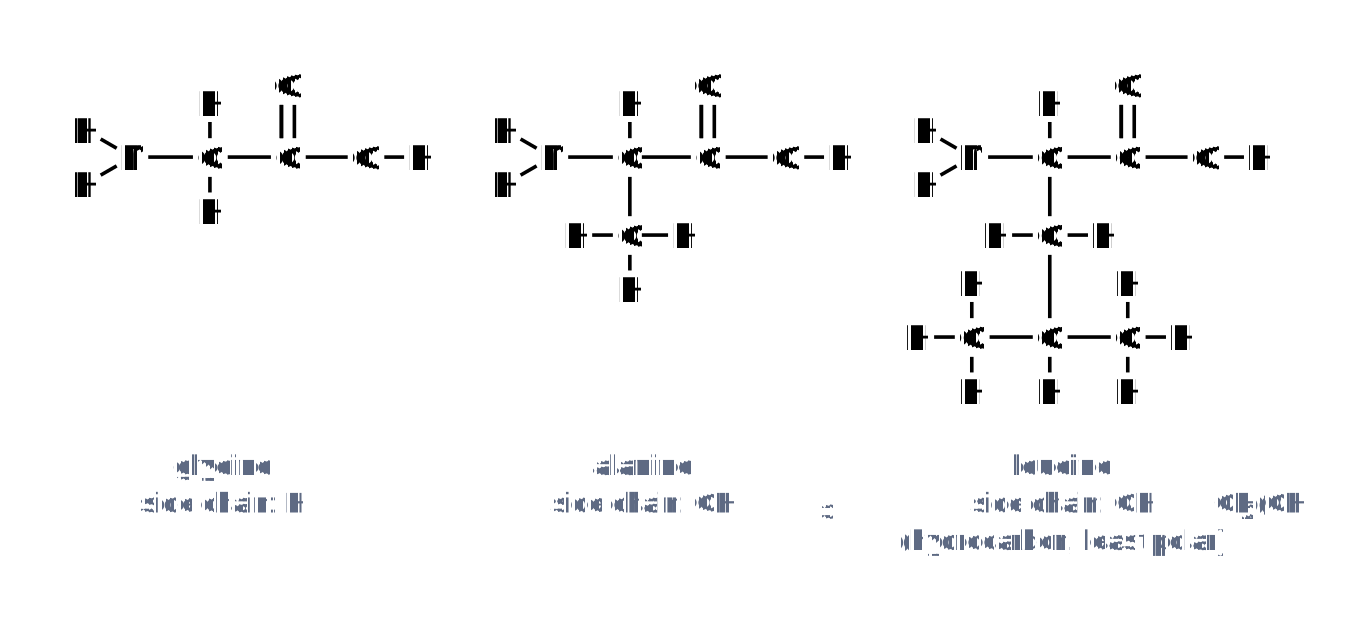
Glycine, alanine and leucine: the amine and carboxylic acid groups are the same in all three; only the side chain changes, from H to CH₃ to a branched C₄H₉ group.
Why leucine moves furthest. All three carry the same polar –NH₂ and –COOH groups. Leucine also has a large hydrocarbon side chain, so it is the least polar: it adsorbs most weakly to the silica and dissolves best in the butan-1-ol.
Why glycine moves least. With only a hydrogen as its side chain, glycine is the most polar of the three, is held most strongly by the –OH groups of the silica, and so has the lowest Rf.
Precision: Measure to the centre of each spot, from the baseline, with the ruler flat on the plate. A spot measured to its leading edge gives an Rf that is too high.
Check: Rf Values From a New Plate
Calculate and match Rf values for a different mixture and solvent front.
Seeing the Spots
Most compounds separated by TLC are colourless, so the plate shows nothing after development. There are four common ways to find the spots; the choice depends on the compounds.
UV lamp. Many plates contain a fluorescent dye that glows green under UV. Compounds that absorb UV (aromatic rings, carbonyl groups) appear as dark spots. Circle each spot in pencil at once: the plate looks blank again in daylight.
Ninhydrin. Spray the dry plate and warm it: amino acids react through their amine group to give purple or pink spots. This is the standard method for amino acids, which carry no useful UV absorbance.
Iodine vapour. Stand the plate in a closed jar with a few iodine crystals: iodine adsorbs onto most organic compounds and gives brown spots that fade in air, so mark them quickly.
Locating agents. Specific reagents sprayed onto the plate colour one class of compound, for example 2,4-dinitrophenylhydrazine for aldehydes and ketones or potassium manganate(VII) for compounds it can oxidise.
Remember: Visualising never changes an Rf: it only shows where the spots already are. Mark the spots in pencil the moment they appear, because UV images and iodine colours fade.
Check: Seeing the Spots and Setting Up
Quick choices on how to make spots visible and why the chamber is set up as it is.
Checking the Purity of a Product
TLC is the quickest check that a prepared solid is pure. One spot in the product lane means one compound; a second spot level with the starting material means the reaction or the purification is incomplete.
Aspirin. A sample of aspirin from Practical Skills: Preparing an Organic Solid (preparation of aspirin) is run against 2-hydroxybenzoic acid on silica, mobile phase ethyl ethanoate : hexane 1 : 1, and viewed under UV. Aspirin gives Rf 0.60 and 2-hydroxybenzoic acid Rf 0.45.
Pure product: one spot at Rf 0.60. Impure product: spots at 0.60 and 0.45
Why the order. 2-Hydroxybenzoic acid has a free phenol –OH as well as the –COOH group, so it hydrogen bonds more strongly to the silica. In aspirin that –OH has been converted to an ester, so aspirin is less polar and moves further.
A sharp melting point confirms the same conclusion from a different direction, and the two checks together are the standard answer to “how would you show the product is pure”.
Exam wording: “The product gives a single spot with the same Rf as pure aspirin, and no spot at the Rf of 2-hydroxybenzoic acid, so no starting material remains.”
Check: Interpreting a Plate
Work out what each plate shows and what to do next, then flip the card.
How Your Course Uses TLC
Your syllabus asks you to describe the stationary phase (aluminium oxide or silica on a solid support), the mobile phase (a polar or non-polar solvent), the baseline, the solvent front and the Rf value, and to explain differences in Rf.
Two explanations are needed. A compound with a low Rf interacts strongly with the stationary phase (adsorption through polar groups) or dissolves poorly in the mobile phase; a high Rf means the reverse. Always give both sides of the balance.
Gas/liquid chromatography follows in the same topic: a high-boiling non-polar liquid on a solid support as the stationary phase, an unreactive gas as the mobile phase, retention time in place of Rf, and peak areas for percentage composition.
Exam wording: “Compound A has the higher Rf because it is less polar: it is adsorbed less strongly by the polar stationary phase and is more soluble in the mobile phase, so it spends more time moving with the solvent.”
What TLC Cannot Tell You
TLC is fast, cheap and needs almost no sample, but it has limits that examiners expect you to state.
Similar compounds, similar Rf. Members of a homologous series or isomers often give spots that overlap, so a single spot does not prove a single compound.
Rf varies between runs. A slightly different solvent mixture, temperature, plate or chamber saturation shifts every value, so a table of Rf values is only a guide; standards must be run alongside.
Not quantitative. The size and darkness of a spot show only roughly how much of a component is present.
Identification needs more. Matching an Rf is consistent with an identity, not proof. Gas chromatography or HPLC separates more finely and gives retention times and peak areas; NMR, infrared and mass spectra identify the compound itself (see the analysis pages of the course).
Remember: Say “consistent with” when a spot matches a standard. Say “pure” only when the product lane shows one spot in more than one solvent system, or a second technique agrees.
Errors, Uncertainty and Improvements
Most TLC errors are technique faults that ruin the plate rather than shift a number. The table gives the ones that appear in evaluation questions.
| Source of error | Effect on the result | Improvement |
|---|---|---|
| Baseline below the solvent level | Spots dissolve into the solvent; faint or missing spots | Pour less solvent; check the level against the pencil line before lowering the plate |
| Too much sample on a spot | Streaks that overlap; Rf cannot be read | Tiny spots; dry and re-spot to build up concentration |
| Lid off or no wick | Solvent evaporates from the plate; uneven front; Rf too high and irreproducible | Lid on, filter paper wick, leave the chamber undisturbed |
| Plate touched with fingers | Dark marks under UV mistaken for spots | Hold by the edges, wear gloves |
| Solvent front not marked at once | Front evaporates; the Rf denominator is guessed | Pencil mark the front the moment the plate is removed |
| Distance measured to the edge of a spot | Rf too high (leading edge) or too low (trailing edge) | Measure to the centre of each spot, ruler flat on the plate |
| Standards run on a different plate or day | Rf values not comparable | Run the standards in lanes beside the mixture on the same plate |
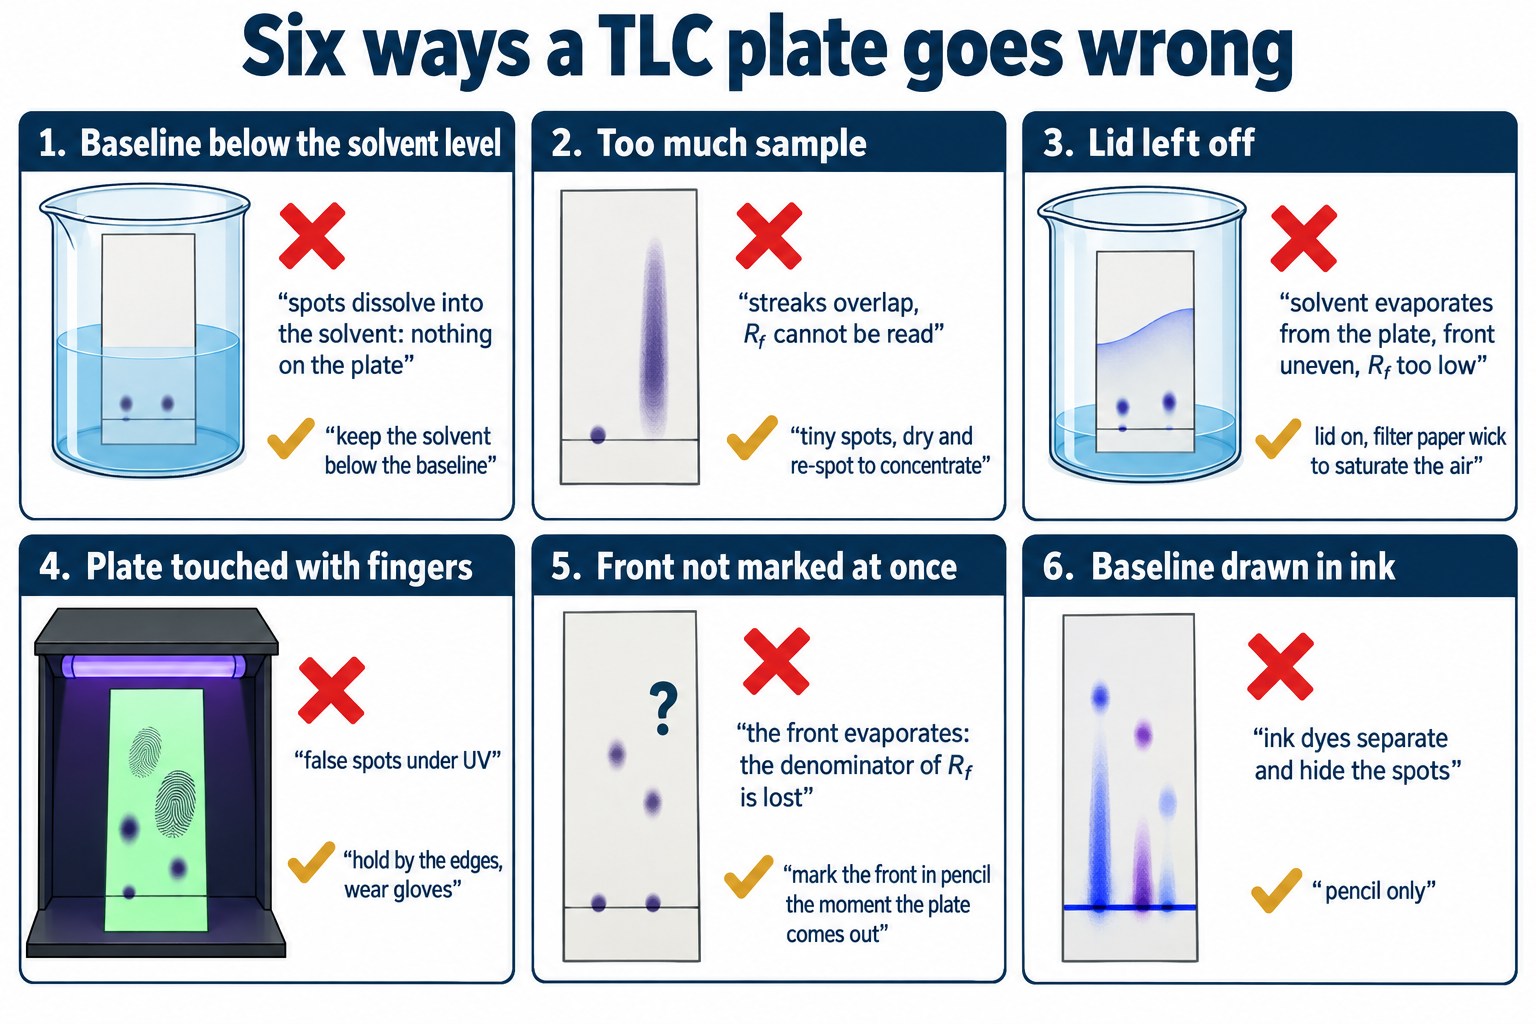
Six ways a plate goes wrong, with the effect of each fault and the fix.
Percentage uncertainty in an Rf. The ruler reads to ±0.5 mm. For spot 1 above, 16 mm from the baseline: (0.5) / (16) × 100 = 3.1%. For the front, 60 mm: (0.5) / (60) × 100 = 0.8%.
Rf is a quotient, so the percentages add: 3.1% + 0.8% = 3.9%, or ±0.01 on an Rf of 0.27
The spot nearest the baseline always carries the largest uncertainty, so the improvement is to let the solvent rise further on a taller plate: every distance grows while the ±0.5 mm stays the same.
Exam focus: For every fault say what it does to the plate and why: “with the lid off, solvent evaporates from the plate, so the front rises less and the Rf values are too high and not reproducible”.
Check: Errors and Uncertainty in TLC
Evaluate new situations and work a ruler uncertainty for a different plate.
Common Mistakes
The same slips appear in write-ups and exam answers every year. Each one costs a mark that the corrected version earns.
Ink baseline. The dyes in ink dissolve and run; use pencil for the baseline, the front and the spot circles.
Solvent over the baseline. The spots wash off into the beaker before the run starts.
Rf with units or above 1. Rf is a ratio of two distances: no units, and a spot cannot pass the solvent front.
Measuring from the wrong line. Both distances start at the baseline, not at the bottom edge of the plate, and the spot distance ends at the centre of the spot.
“Polar compounds dissolve in the silica”. They adsorb to its surface; dissolving happens in the mobile phase.
Calling a match proof. The same Rf as a standard is consistent with the identity; another compound could share it.
Forgetting why the lid is on. It saturates the chamber with vapour so solvent does not evaporate from the plate, giving an even front and reproducible Rf values.
Common Exam Points
Say
“Rf = (distance moved by the spot) / (distance moved by the solvent front); no units.” “The more polar compound is adsorbed more strongly, so its Rf is lower.” “Mark the front at once in pencil: the solvent evaporates.” “Standards on the same plate.”
Do not say
“Draw the baseline in pen.” “Rf is 0.65 cm.” “The compound with the higher Rf is more soluble in the silica.” “One spot proves the product is pure.” “The lid stops the solvent escaping from the beaker” (it keeps the air saturated).
Watch for
Reading a plate drawn to scale (baseline to spot centre); an order of Rf values explained by polarity; a product’s purity check against its starting material; ±0.5 mm ruler uncertainty on the smallest distance; a spot left on the baseline or at the front.
FAQs
Short answers to the questions students most often ask about thin-layer chromatography.
Why does Rf have no units, and can it be more than 1?
Rf is one distance divided by another, so the units cancel. A spot is carried by the solvent and cannot overtake it, so Rf is always between 0 and 1; a value above 1 means the front or the baseline was marked wrongly.
Why do polar compounds have a lower Rf on silica?
The silica surface is covered in polar –OH groups. Polar molecules hydrogen bond to them and spend more time adsorbed on the surface than moving in the solvent, so they travel a shorter distance before the run stops.
Why must the solvent level be below the baseline?
If the spots are under the solvent they dissolve straight into the liquid in the beaker instead of being carried up the plate. The plate then shows faint spots or nothing at all.
Why is the beaker covered, and what is the filter paper for?
The lid and the wick keep the air in the chamber saturated with solvent vapour. Without them solvent evaporates from the plate as it rises, the front is uneven and lags behind, and the Rf values are too high and not reproducible.
Can I identify a compound from its Rf alone?
No. A matching Rf against a standard run on the same plate is consistent with the identity, but other compounds can share an Rf. Run a second solvent, or confirm with a spectrum or a sharp melting point.
Copyright notice: This OLS revision content, including the explanations, layout, diagrams, tables and embedded learning structure, is authored for Online Learning System by Dr. Mohammed Al-Fatah. It may not be copied, reproduced, redistributed or adapted without written permission.
Keep this note — free
Save your progress across every Cambridge topic. A free account remembers which topics you have covered, saves your question scores, and syncs across your phone and laptop.
- Track every topic you have finished
- Keep your practice-question scores
- No payment, no card, free forever
Already registered? Log in