Enthalpy Changes and Standard Conditions
A concise revision guide to enthalpy change, exothermic and endothermic reactions, enthalpy level diagrams, activation energy and standard conditions for Edexcel A Level Chemistry.
GCSE Recap: Energy Diagrams and Which Way the Energy Goes
Before you start, check the GCSE picture that this page turns into ΔH.
What an Enthalpy Change Is
An enthalpy change, ΔH, is the heat energy transferred in a reaction measured at constant pressure. It is measured in kJ mol⁻¹, so it always refers to the amounts shown in a stated equation or to one mole of a named substance. Scale the equation and the value scales with it: CH₄(g) + 2O₂(g) → CO₂(g) + 2H₂O(l) has ΔH = −890 kJ mol⁻¹, while 2CH₄(g) + 4O₂(g) → 2CO₂(g) + 4H₂O(l) has ΔH = −1780 kJ mol⁻¹ for the same reaction written for twice as much.
Chemists split the world into two parts. The system is the reacting chemicals; the surroundings are everything else, including the solvent, the container and the air. An enthalpy change describes energy moving between the two, which is why a thermometer placed in the surroundings can be used to measure it.
Definition: Enthalpy change, ΔH, is the heat energy change measured at constant pressure.
Exothermic and Endothermic Reactions
In an exothermic reaction energy is transferred from the system to the surroundings, so the surroundings get warmer and ΔH is negative. The products have less enthalpy than the reactants. Combustion of fuels, neutralisation and respiration are all exothermic.
In an endothermic reaction energy is transferred from the surroundings to the system, so the surroundings cool and ΔH is positive. The products have more enthalpy than the reactants. Thermal decomposition of calcium carbonate, photosynthesis and dissolving ammonium nitrate in water are endothermic.
| Feature | Exothermic | Endothermic |
|---|---|---|
| Direction of energy transfer | system to surroundings | surroundings to system |
| Sign of ΔH | negative | positive |
| Temperature of surroundings | rises | falls |
| Enthalpy of products | lower than reactants | higher than reactants |
| Example | CH₄ + 2O₂ → CO₂ + 2H₂O | CaCO₃ → CaO + CO₂ |
Common mistake: A temperature rise means the reaction is exothermic, not endothermic. The heat has left the chemicals and entered the solution, which is what the thermometer measures.
Quick Check: Two Everyday Changes
Drag the words into place to complete the two accounts.
Drawing Enthalpy Level Diagrams
An enthalpy level diagram shows the enthalpy of the reactants and the products as two horizontal levels, with an arrow between them for ΔH. The vertical axis is labelled enthalpy; the horizontal axis is the progress of the reaction.
- Draw the reactants level and the products level, and label each with its formula.
- For an exothermic reaction place the products below the reactants; for an endothermic reaction place them above.
- Draw a vertical arrow from the reactants level to the products level and label it with ΔH and its sign, for example ΔH = −890 kJ mol⁻¹.
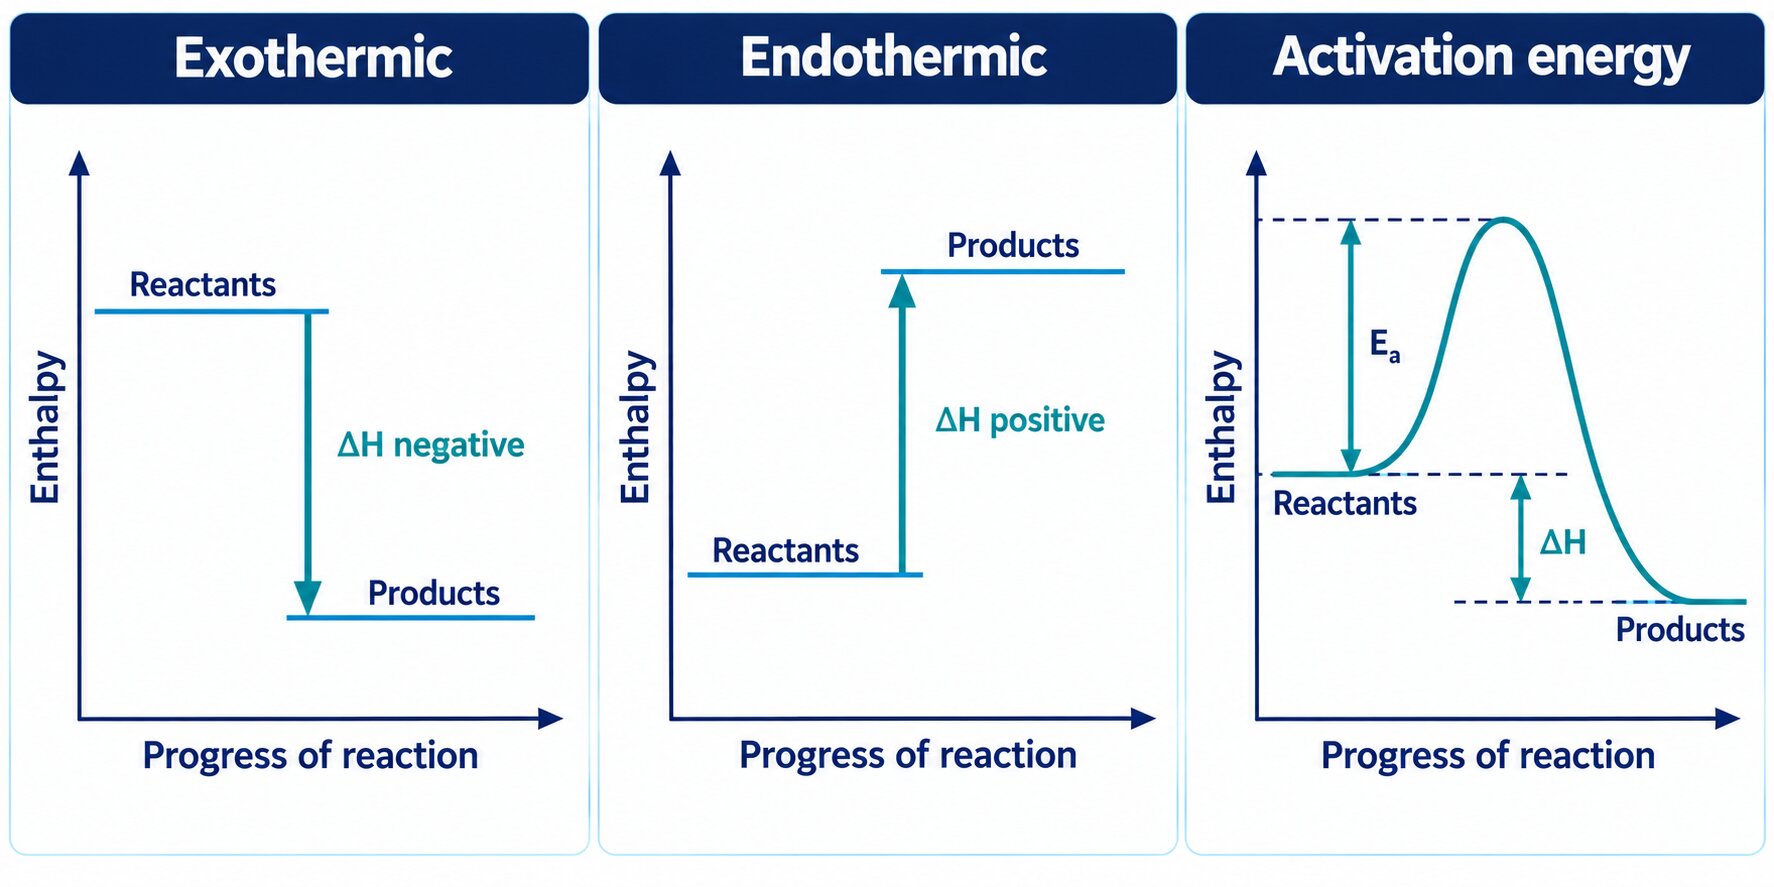
The direction of the ΔH arrow shows the sign: down for exothermic, up for endothermic.
An Exothermic Reaction: Energy Profile
Follow hydrogen burning in oxygen, 2H2 + O2 → 2H2O, bond by bond, with a live energy profile showing why more energy comes out than goes in.
© Dr. Mohammed Al-Fatah – onlinelearningsystem.net
An Endothermic Reaction: Energy Profile
Heat calcium carbonate until CO2 leaves, CaCO3 → CaO + CO2, with a live energy profile showing why the products end up higher in energy than the reactant.
© Dr. Mohammed Al-Fatah – onlinelearningsystem.net
Exam focus: Label both levels with formulae and state symbols, and make the arrow point from reactants to products. An arrow drawn the wrong way reverses the sign and loses the mark.
Quick Check: Levels and Arrows
Answer each one quickly, using the value or the observation given.
Activation Energy and the Reaction Profile
The activation energy, Ea, is the minimum energy that colliding particles need for a reaction to occur. It is the energy needed to start breaking bonds, so even very exothermic reactions such as the combustion of methane need a spark or flame to begin.
An enthalpy level diagram shows only the enthalpy change. A reaction profile diagram adds the curve over the top, so the activation energy can be read as the height of the peak above the reactants. Edexcel expects you to know that activation energy is shown on a reaction profile but not on an enthalpy level diagram.
The same peak gives the activation energy for the reverse reaction, measured from the products level up to the top of the curve. For an exothermic reaction the reverse barrier is the larger of the two; for an endothermic reaction it is the smaller.
Key idea: ΔH is fixed by the reactants and products; activation energy is the barrier between them. A catalyst lowers the barrier without changing ΔH.
Quick Check: Read the Two Heights
Work out both values from the described profile, then choose your answer.
Standard Conditions
Enthalpy changes depend on temperature, pressure and concentration, so values are compared under standard conditions: a pressure of 100 kPa, a stated temperature (usually 298 K), solutions at a concentration of 1 mol dm⁻³, and every substance in its standard state, the physical state it adopts under those conditions. The symbol ⦵ shows that a value was measured, or corrected, to standard conditions.
| Condition | Standard value |
|---|---|
| Pressure | 100 kPa |
| Temperature | 298 K (25 °C) unless another temperature is stated |
| Solution concentration | 1 mol dm⁻³ |
| Physical state | the normal state at 298 K and 100 kPa, for example H₂O(l), CO₂(g), C(s, graphite) |
Standard states matter because changing a state involves an enthalpy change of its own. Forming water as a gas gives a less exothermic value than forming liquid water, because the energy that would be released on condensing is not released. That is about 44 kJ mol⁻¹ for every mole of water, so the two values can differ by a great deal.
Remember: Standard pressure is 100 kPa. Temperature must be stated; 298 K is used unless a question says otherwise.
Quick Check: Standard States
Click every formula that shows the substance in its standard state.
Quick Check: Pick the Accurate Statement
In each round, choose the one statement that is accurate.
Common Exam Points
Define enthalpy change
The heat energy change measured at constant pressure.
Explain why a reaction is exothermic from a temperature change
The temperature of the surroundings rose, so energy was transferred from the chemicals to the surroundings and ΔH is negative.
Draw an enthalpy level diagram
Label the enthalpy axis, both levels with formulae, and an arrow from reactants to products labelled with ΔH and its sign.
Do not say
“Exothermic reactions absorb heat”; “ΔH is positive because heat is given out”; “standard temperature is 273 K”.
Master Energetics I for Edexcel A Level Chemistry
Continue from these free revision notes into the full Topic 8 Energetics I course, with guided video teaching, diagnostic MCQ practice, teacher-marked short-answer questions and a specification assignment with a personalised progress report.
Guided video teaching
Learn the chemistry and exam technique through structured video lessons with worked examples and walkthroughs.
Instant MCQ feedback
Auto-marked MCQ quizzes provide immediate diagnostic feedback for every answer choice.
Teacher-marked SAQs
Submit written exam responses and receive chemistry specialist feedback with improvement guidance.
Progress tracking
Identify strengths and weaknesses across the full Topic 8 specification with targeted reporting.
See how the course works
Click play to start the course preview animation.
Some ionic radii are shown.
| Ion | Ionic radius / nm |
|---|---|
| Na+ | 0.102 |
| K+ | 0.138 |
| F− | 0.133 |
| Cl− | 0.180 |
Which compound has the strongest ionic bonding?
Explain why the metallic bonding in magnesium is much stronger than that in sodium.
FAQs
Use these quick answers to check the enthalpy ideas that appear most often in Edexcel A Level Chemistry questions.
What is an enthalpy change?
It is the heat energy change measured at constant pressure, quoted in kJ mol⁻¹. It describes energy moving between the reacting chemicals and their surroundings.
How do I know if a reaction is exothermic?
The temperature of the surroundings rises, because energy has been transferred from the chemicals to the surroundings. ΔH is negative and the products have less enthalpy than the reactants.
What does an enthalpy level diagram show?
The enthalpy of the reactants and products as two levels, with an arrow from reactants to products labelled with ΔH. It does not show the activation energy; a reaction profile does.
What are standard conditions?
A pressure of 100 kPa, a stated temperature (usually 298 K), solutions at 1 mol dm⁻³, and every substance in its standard state. The symbol ⦵ marks a standard value.
Does a catalyst change ΔH?
No. A catalyst lowers the activation energy, so the reaction is faster, but the enthalpies of the reactants and products are unchanged, so ΔH stays the same.
Copyright and author footprint: This OLS revision page was written for Online Learning System by Dr. Mohammed Al-Fatah. It is designed for A Level Chemistry revision and should not be copied or redistributed without permission.
Keep this note — free
Save your progress across every Edexcel topic. A free account remembers which topics you have covered, saves your question scores, and syncs across your phone and laptop.
- Track every topic you have finished
- Keep your practice-question scores
- No payment, no card, free forever
Already registered? Log in