Chromatography: Paper, Thin-Layer and Rf Values
A concise revision guide to chromatography: the stationary and mobile phases, how paper and thin-layer chromatography separates a mixture, calculating Rf values and explaining why they differ.
- 15.21-a
- 15.21-b
- 15.22-a
- 15.22-b
- 15.22-c
What these spec points say
- 15.21-a know that chromatography separates components of a mixture using a mobile phase
- 15.21-b know that chromatography separates components of a mixture using a stationary phase
- 15.22-a be able to calculate Rf values from one-way paper chromatograms
- 15.22-b be able to calculate Rf values from one-way thin-layer chromatograms
- 15.22-c understand reasons for differences in Rf values
Before You Start
Chromatography separates the substances in a mixture so that each one can be identified. It works alongside the spectroscopic methods on Proton NMR Spectroscopy and in Topic 10 Alcohols, Halogenoalkanes and Spectra.
GCSE Recap: Reading a Chromatogram
Three quick questions on the GCSE chromatography this page builds on.
Mobile Phase and Stationary Phase
Chromatography is a family of techniques used to separate and identify the components of a mixture. Every type has two phases.
| Phase | What it is | What it does |
|---|---|---|
| Mobile phase | a liquid or a gas that moves | carries the components of the mixture along |
| Stationary phase | a solid, or a liquid held on a solid support, that stays in place | holds the components back |
Why the components separate
- Each component is attracted to the stationary phase and is also soluble in the mobile phase.
- A component that is held strongly by the stationary phase moves slowly.
- A component that is more soluble in the mobile phase moves quickly.
- Different components strike a different balance, so they travel at different speeds and separate.
On a solid stationary phase the components are held by adsorption: they stick to its surface. On a liquid stationary phase they separate by their relative solubility in the two phases.
Key idea: Separation depends on the balance between how strongly a component is held by the stationary phase and how soluble it is in the mobile phase.
Thin-Layer Chromatography (TLC)
In thin-layer chromatography the stationary phase is a thin layer of a solid, silica (SiO₂) or alumina (Al₂O₃) on a glass, plastic or metal plate. The mobile phase is a liquid solvent that rises up the plate.
Running a TLC plate
- Draw a baseline in pencil about 1 cm from the bottom of the plate.
- Use a capillary tube to place a small, concentrated spot of each sample on the baseline. Let it dry.
- Stand the plate in a tank containing a shallow layer of solvent. The solvent level must be below the baseline.
- Cover the tank with a lid, so that the air inside stays saturated with solvent vapour.
- When the solvent is near the top, remove the plate and mark the solvent front in pencil at once.
- Dry the plate, then locate and circle the spots.
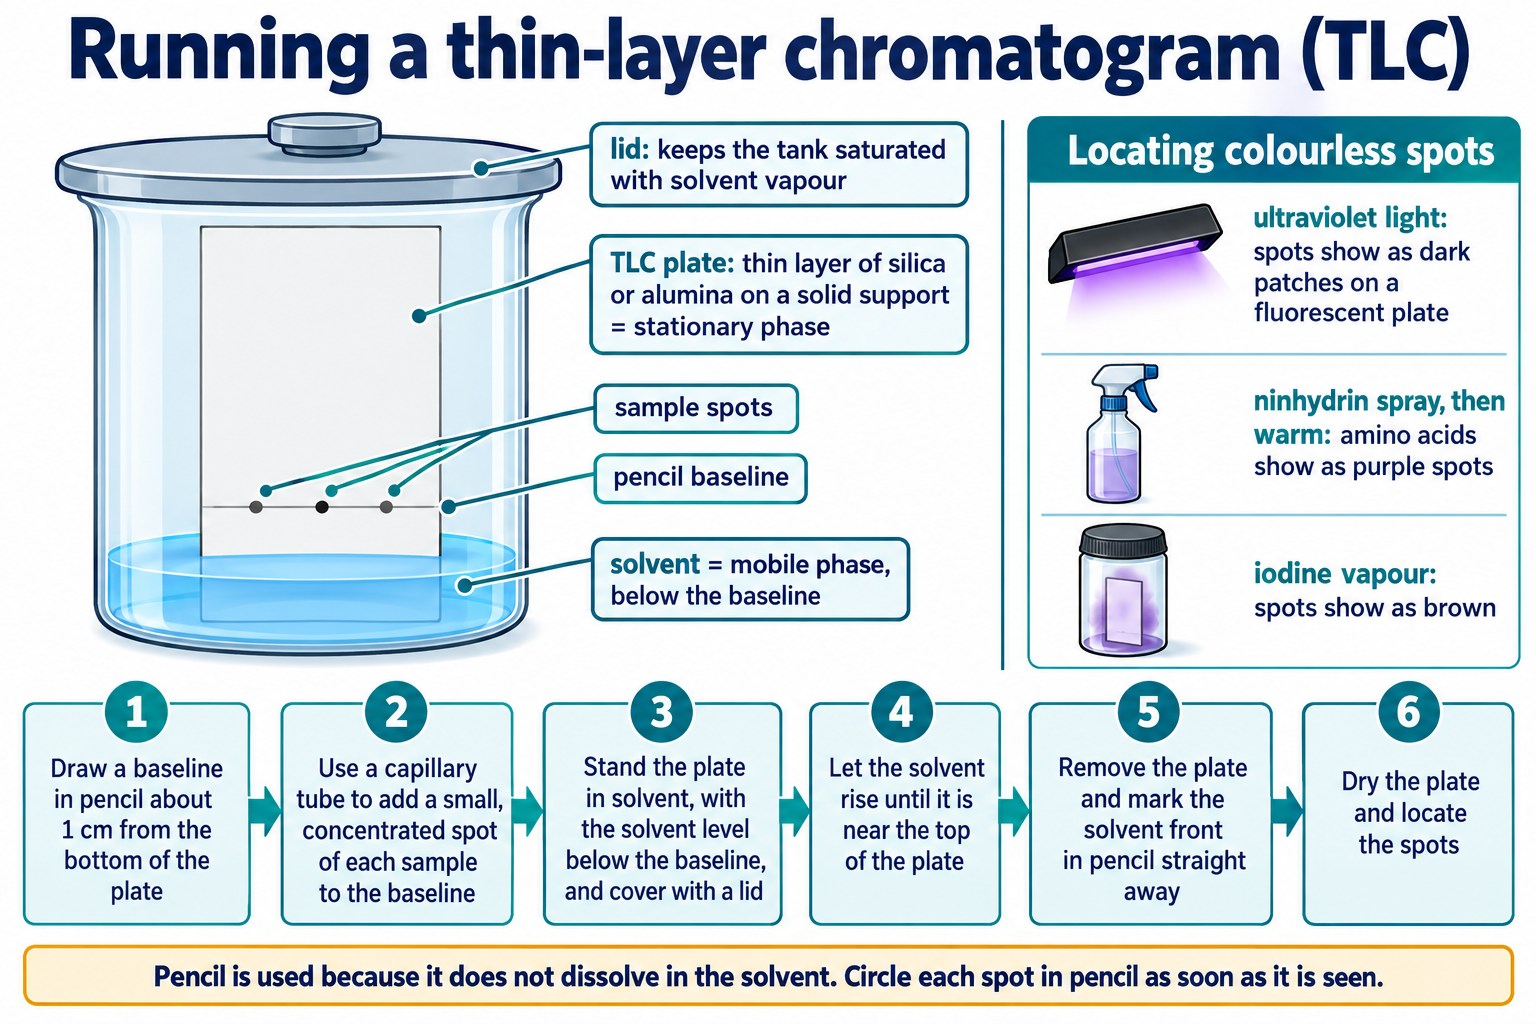
Running a thin-layer chromatogram: the covered tank, the pencil baseline above the solvent level, the six steps and three ways to locate colourless spots.
Why each step matters
- Pencil is used because ink would dissolve in the solvent and run up the plate.
- If the solvent covered the baseline, the samples would dissolve into the tank.
- Small spots give sharp, well-separated spots on the finished plate.
- The solvent front is marked at once because the solvent evaporates quickly.
Locating colourless spots
| Locating agent | How it is used | What is seen |
|---|---|---|
| Ultraviolet light | shine UV on a plate that contains a fluorescent dye | dark spots on a glowing background |
| Ninhydrin | spray, then warm the plate | amino acids appear as purple spots |
| Iodine | stand the plate in a jar with iodine crystals | brown spots |
Paper Chromatography
In paper chromatography the method is the same, but a sheet of chromatography paper replaces the plate.
- The stationary phase is the water held on the cellulose fibres of the paper.
- The mobile phase is the solvent that rises up the paper.
- Each component is shared between the water on the fibres and the moving solvent, according to its solubility in each.
- A component that is more soluble in the moving solvent travels further up the paper.
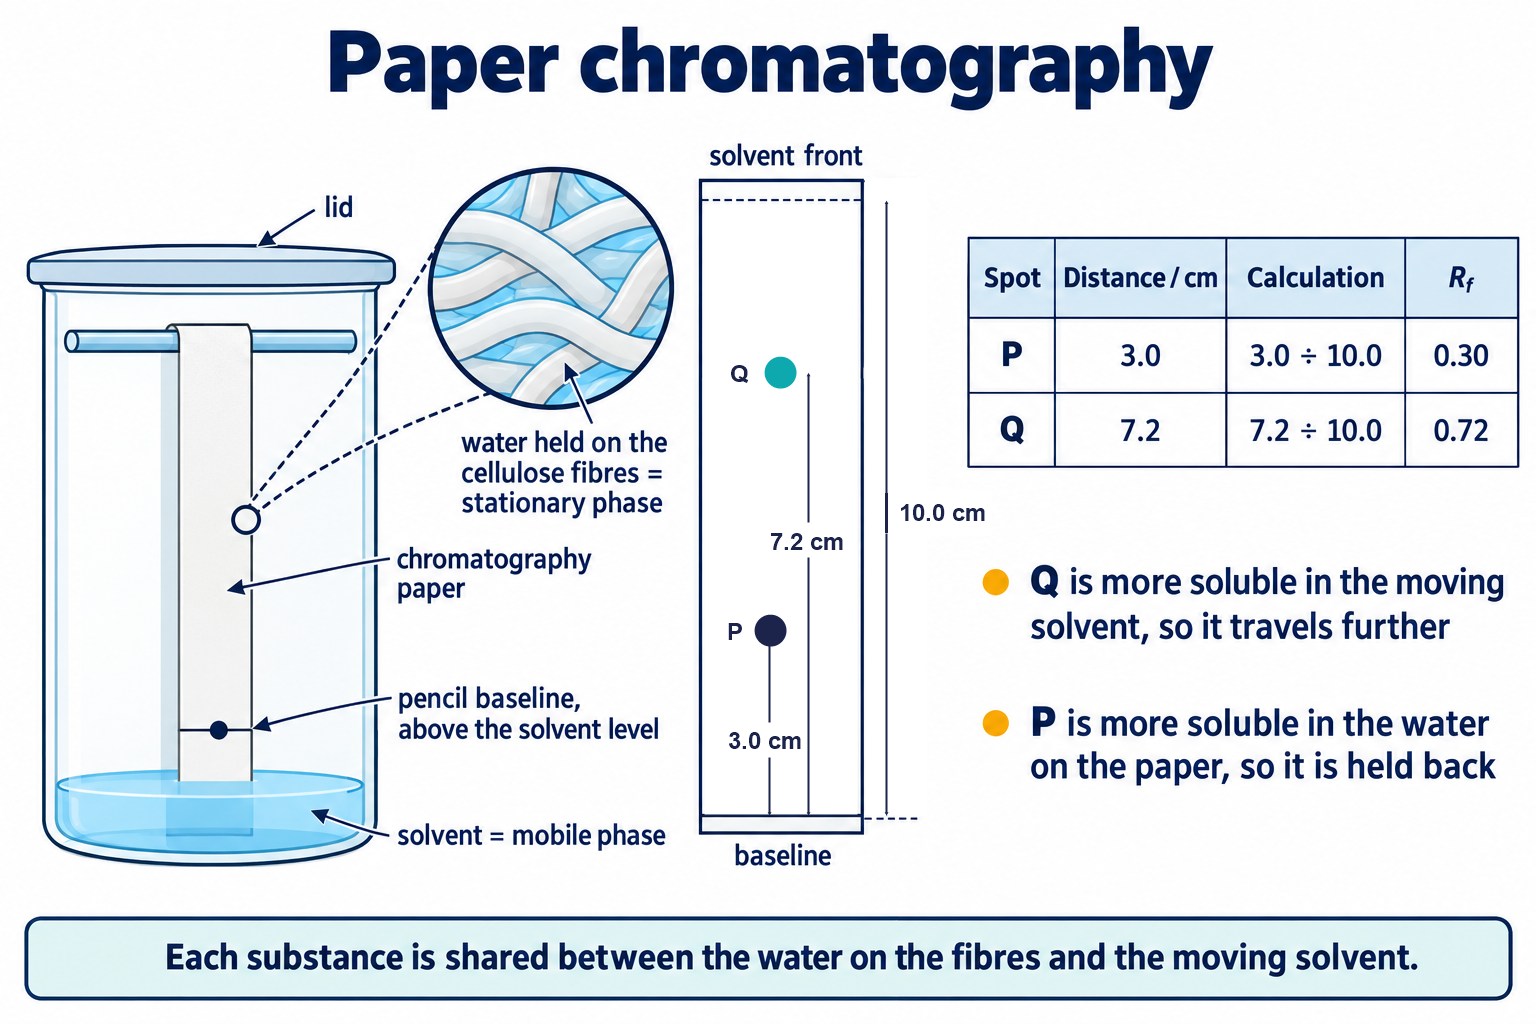
Paper chromatography: water on the cellulose fibres as the stationary phase, the rising solvent as the mobile phase, and Rf values of 0.30 and 0.72 from measured distances.
| Paper chromatography | Thin-layer chromatography | |
|---|---|---|
| Stationary phase | water held on cellulose fibres | solid silica or alumina |
| Mobile phase | liquid solvent | liquid solvent |
| Separation by | relative solubility in the two liquids | adsorption on the solid surface |
| Speed and quality | slower, spots spread more | faster, sharper spots |
Check: Phases and Method
Identify the mobile and stationary phases and explain the steps of running and developing a chromatogram, in situations not used on this page.
Rf Values
Definition: Rf value = (distance moved by the spot) / (distance moved by the solvent front). Both distances are measured from the baseline.
- Measure to the centre of the spot.
- Rf has no units and is always between 0 and 1.
- Under fixed conditions each substance has a characteristic Rf value.
Worked example
On a TLC plate the solvent front is 8.0 cm from the baseline. Three known compounds, A, B and C, give spots at 2.0 cm, 4.8 cm and 6.8 cm. A mixture, M, gives spots at 2.0 cm and 6.8 cm.
Step 1. Rf of A = (2.0) / (8.0) = 0.25.
Step 3. The spots of M have Rf = (2.0) / (8.0) = 0.25 and (6.8) / (8.0) = 0.85.
Answer. M contains A and C, but not B.
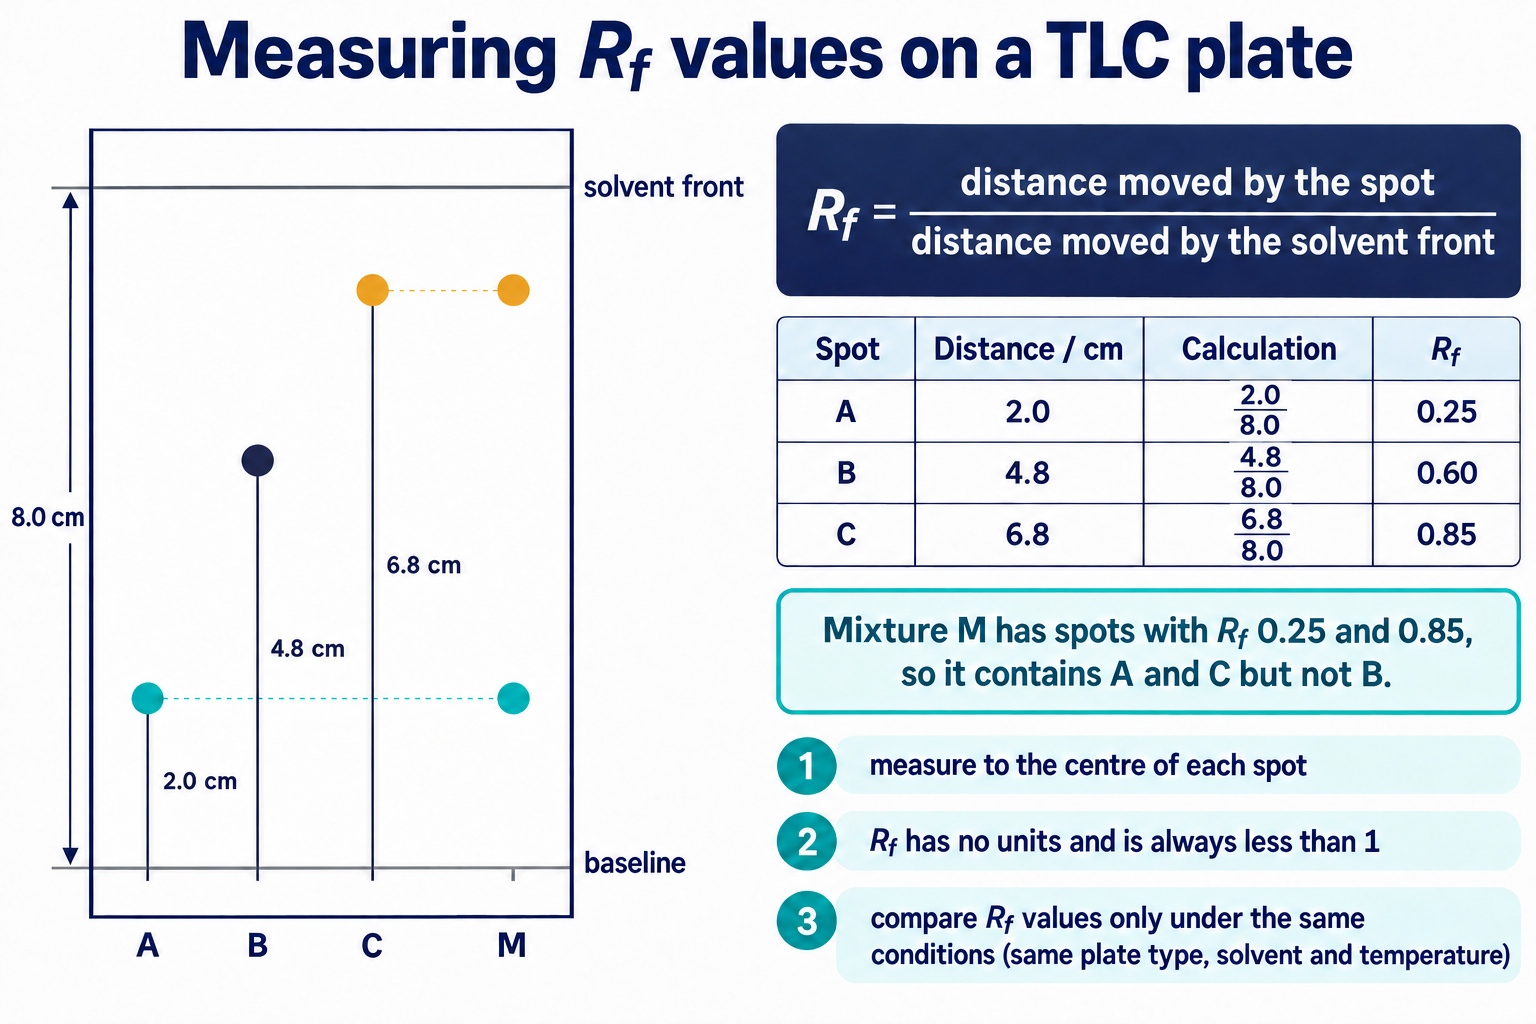
A finished TLC plate with the distances marked: solvent front 8.0 cm; A 2.0 cm (Rf 0.25), B 4.8 cm (Rf 0.60), C 6.8 cm (Rf 0.85). Mixture M matches A and C.
Identifying a substance
- Compare the Rf value with known values, or run pure reference samples on the same plate.
- Rf values only match under the same conditions: the same stationary phase, solvent and temperature.
- Two different substances can have the same Rf in one solvent. Run again in a different solvent to check.
- A pure substance gives a single spot. More than one spot shows a mixture.
Quick Check: Confirming an Identity With Two Solvents
Turn the measured distances into Rf values, then compare them with the table.
Why Rf Values Differ
Silica and alumina are polar. The silica surface carries O–H groups, which can form hydrogen bonds and dipole–dipole attractions with polar molecules.
| Component | Interaction with the polar stationary phase | Result |
|---|---|---|
| More polar (for example with O–H or N–H groups) | adsorbed strongly | moves slowly: small Rf |
| Less polar | adsorbed weakly; stays mostly in the solvent | moves quickly: large Rf |
- A component that is more soluble in the mobile phase spends more time moving, so its Rf is larger.
- Changing to a more polar solvent moves every component further and raises the Rf values.
- In the worked example, A (Rf 0.25) is held most strongly by the stationary phase and C (Rf 0.85) least strongly.
Exam wording: “The spot with the smaller Rf value is more strongly adsorbed on the stationary phase and less soluble in the mobile phase, so it moves more slowly.”
Quick Check: Predicting Rf From Polarity
Pick the one accurate statement in each set, for compounds that are new to this page.
Common Exam Points
Say
- “Rf = (distance moved by the spot) / (distance moved by the solvent front).”
- “The baseline is drawn in pencil because pencil does not dissolve in the solvent.”
- “The component is identified by comparing its Rf value with known values under the same conditions.”
Do not say
- “The spot moved further because it is lighter” (use attraction to the stationary phase and solubility in the mobile phase).
- “Rf = (distance moved by the solvent) / (distance moved by the spot)” (this gives a value above 1).
- “One spot proves the substance is pure” (two substances can share an Rf in one solvent).
Watch for
- Measuring from the baseline, not from the bottom edge of the plate.
- Giving Rf to 2 significant figures, with no units.
- Explaining why a lid is used and why the solvent must start below the baseline.
Check: Rf Values
Calculate Rf values from measured distances, identify the components of a mixture and explain why Rf values differ, using data not used on this page.
FAQs
Use these quick answers to check chromatography and Rf values.
What are the mobile phase and the stationary phase?
The mobile phase moves and carries the mixture along; the stationary phase stays in place. In thin-layer chromatography the stationary phase is a thin layer of silica or aluminium oxide on a plate and the mobile phase is a solvent.
Why do the substances in a mixture separate?
Each component is attracted to the stationary phase, and is soluble in the mobile phase, to a different extent. One held strongly by the stationary phase moves slowly; one more soluble in the mobile phase travels further.
How do I calculate an Rf value?
Rf = (distance moved by the spot) / (distance moved by the solvent front), both measured from the baseline, using the centre of the spot. A spot moving 3.0 cm when the solvent front moves 6.0 cm has Rf = 0.50. Rf has no units.
Why is the baseline drawn in pencil, above the solvent level?
Pencil is insoluble, whereas ink would dissolve and run with the solvent. The solvent must start below the baseline, otherwise the spots would dissolve into the solvent in the tank instead of being carried up the plate.
How is paper chromatography different from TLC?
The stationary phase is water held on the cellulose fibres of the paper, rather than a solid layer of silica. Components separate according to how they are shared between this water and the moving solvent. Rf values are found in the same way.

Copyright notice: This OLS revision content, including the explanations, layout, diagrams, tables and embedded learning structure, is authored for Online Learning System by Dr. Mohammed Al-Fatah. It may not be copied, reproduced, redistributed or adapted without written permission.
Keep this note — free
Save your progress across every Edexcel IAL topic. A free account remembers which topics you have covered, saves your question scores, and syncs across your phone and laptop.
- Track every topic you have finished
- Keep your practice-question scores
- No payment, no card, free forever
Already registered? Log in