Gas Chromatography and Retention Times
A concise revision guide to gas chromatography: how the column separates a mixture, retention times, peak areas and the proportions of the components, and why chromatography is joined to mass spectrometry.
- 6.3.1(b)(i)
- 6.3.1(b)(ii)
What these spec points say
- 6.3.1(b)(i) interpretation of gas chromatograms in terms of retention times
- 6.3.1(b)(ii) interpretation of gas chromatograms in terms of the amounts and proportions of the components in a mixture
Before You Start
This page uses the ideas of a mobile phase and a stationary phase from Chromatography and Rf Values. The mass spectrometry it mentions is in 4.2.4 Analytical techniques.
How Gas chromatography Works
Gas chromatography (GC) separates mixtures of volatile substances. The mixture is carried as a vapour through a long column.
| Part | Description |
|---|---|
| Mobile phase | an inert (unreactive) carrier gas, such as nitrogen or helium |
| Stationary phase | a high-boiling liquid on a solid support, inside the column |
| Column | a long, thin, coiled tube inside an oven |
| Oven | keeps the column at a controlled high temperature |
| Detector | responds as each component leaves the column |
What happens to the sample
- A small sample is injected and vaporised at the hot injection port.
- The carrier gas sweeps the vapour into the column under pressure.
- Each component keeps dissolving in the liquid stationary phase and returning to the gas.
- A component that is more soluble in the stationary phase spends less time moving, so it travels more slowly.
- The components reach the detector one after another, and each gives a peak on the chromatogram.
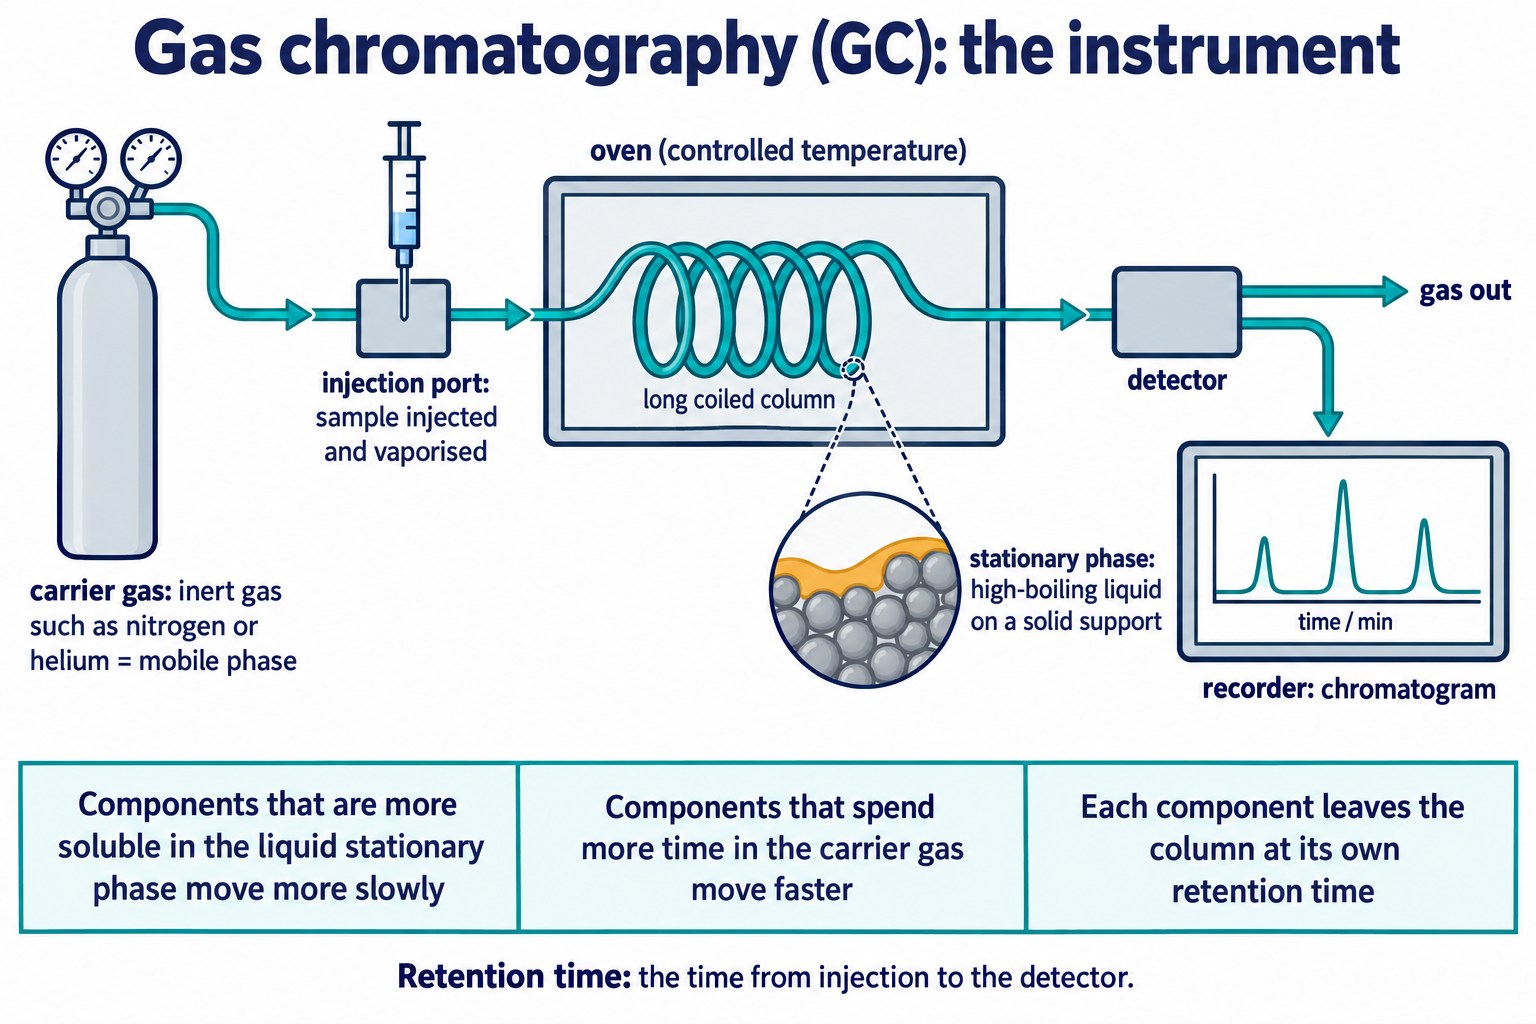
A gas chromatograph: inert carrier gas, injection port, long coiled column in an oven with a high-boiling liquid on a solid support, detector and recorder.
Key idea: In gas chromatography the mobile phase is an inert gas and the separation depends on how long each component spends dissolved in, or held by, the stationary phase.
Retention Time
Definition: Retention time: the time from the injection of the sample to the detection of a component, that is, the time the component takes to pass through the column.
What affects retention time
- Volatility: a component with a lower boiling point spends more time in the gas, so it has a shorter retention time.
- Attraction to the stationary phase: a component that is more soluble in it, or more strongly held by it, has a longer retention time.
- Conditions: column temperature, carrier gas flow rate, column length and the stationary phase used.
Identifying components
Under fixed conditions each substance has its own retention time. Run pure known substances (standards) under the same conditions and compare.
| Standard | Retention time / min |
|---|---|
| Ethanol | 1.8 |
| Propan-1-ol | 3.2 |
| Butan-1-ol | 5.5 |
| Pentan-1-ol | 8.1 |
A mixture gives three peaks, at 1.8, 3.2 and 5.5 min. It contains ethanol, propan-1-ol and butan-1-ol. There is no peak at 8.1 min, so it contains no pentan-1-ol.
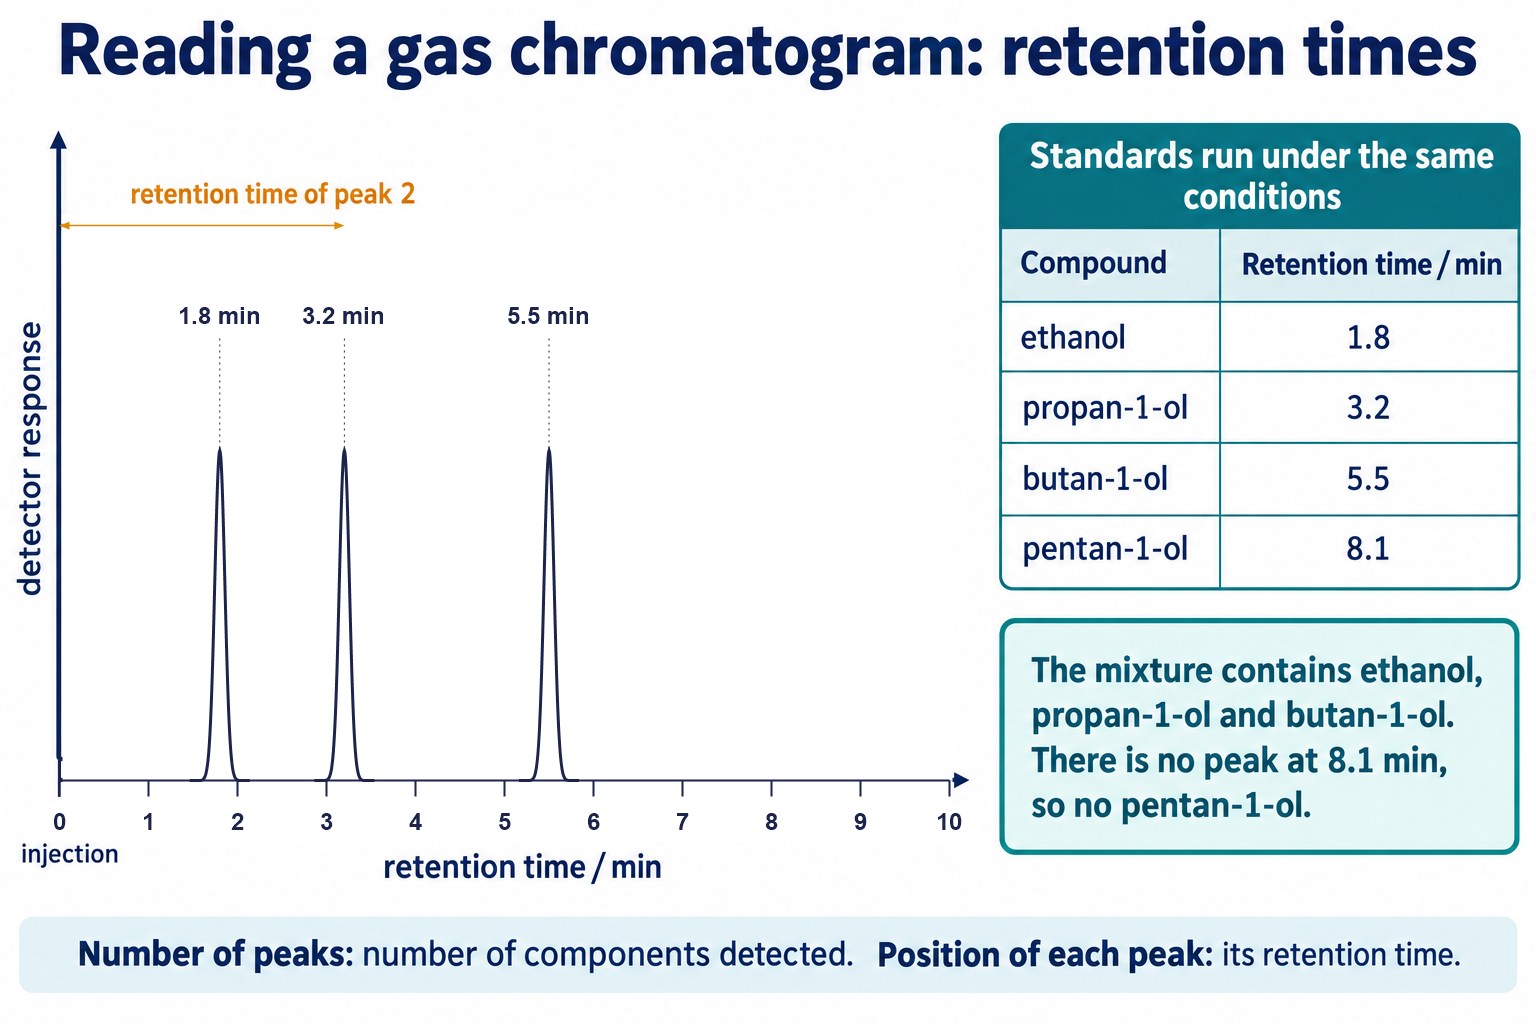
A gas chromatogram with peaks at 1.8, 3.2 and 5.5 min, identified by comparing with the retention times of standards run under the same conditions.
- The number of peaks shows the number of components detected.
- In this series the retention time rises with chain length, as the alcohols become less volatile.
Check: The Instrument and Retention Times
Describe the phases in gas chromatography and use retention times to identify the components of a mixture, with data not used on this page.
Quick Check: Which Alkane Comes Out First?
Use volatility to predict the order in which four new compounds reach the detector.
Peak Areas and Amounts
The area under each peak is proportional to the amount of that component in the mixture. Comparing areas gives the proportions of the components.
percentage of a component = (area of its peak) / (total area of all peaks) × 100
Worked example
A chromatogram has three triangular peaks, X, Y and Z. Their bases are 0.4, 0.5 and 0.6 min wide and their heights are 60, 120 and 60 units. Find the percentage composition.
Step 2. Total area = 12.0 + 30.0 + 18.0 = 60.0.
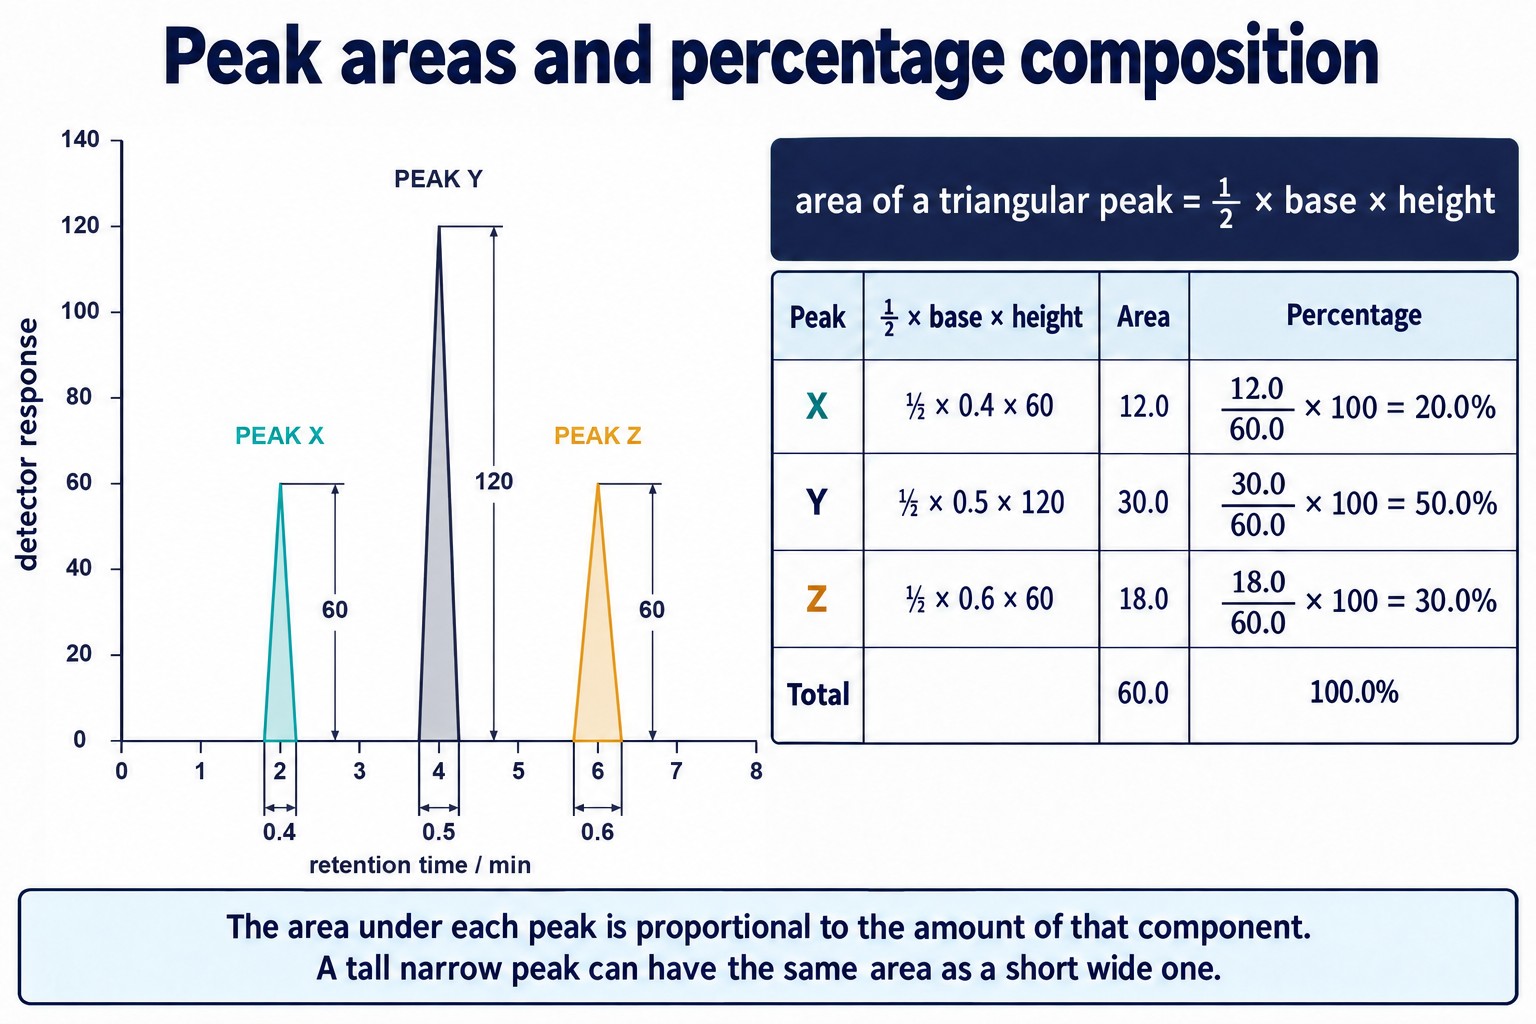
Peak areas from ½ × base × height: 12.0, 30.0 and 18.0 units, total 60.0, giving 20.0%, 50.0% and 30.0% of the mixture.
- Use the area, not the height: peak Z is as tall as peak X but wider, so it represents more substance.
- The method assumes the detector responds equally to each component.
Calibration with known concentrations
To find an actual concentration, the instrument is calibrated with an external calibration curve.
- Prepare standard solutions of the compound with known concentrations.
- Run each one under the same conditions and measure its peak area.
- Plot peak area against concentration to give a calibration curve.
- Run the sample, measure its peak area and read its concentration from the curve.
| Concentration / mol dm⁻³ | Peak area |
|---|---|
| 0.10 | 15 |
| 0.20 | 30 |
| 0.30 | 45 |
The line is straight and passes through the origin, with area = 150 × concentration. A sample with a peak area of 36 has a concentration of (36) / (150) = 0.24 mol dm⁻³.
Exam focus: Retention time identifies a component. Peak area shows how much of it is present.
Quick Check: Work Out the Composition
Work each step on paper, then flip the card to check your working.
GC-MS: Gas Chromatography With Mass Spectrometry
Retention times alone have limits.
- Similar compounds can have very similar retention times.
- A retention time identifies a substance only if a standard is available to compare with.
- A new or unexpected compound cannot be identified this way.
Separate, then identify
In GC-MS the gas chromatograph is connected to a mass spectrometer. The two instruments do different jobs.
- The GC column separates the components of the mixture.
- Each component passes, in turn, straight into the mass spectrometer.
- A mass spectrum is recorded for each one.
- Each spectrum is compared with a database of known spectra to identify the compound.
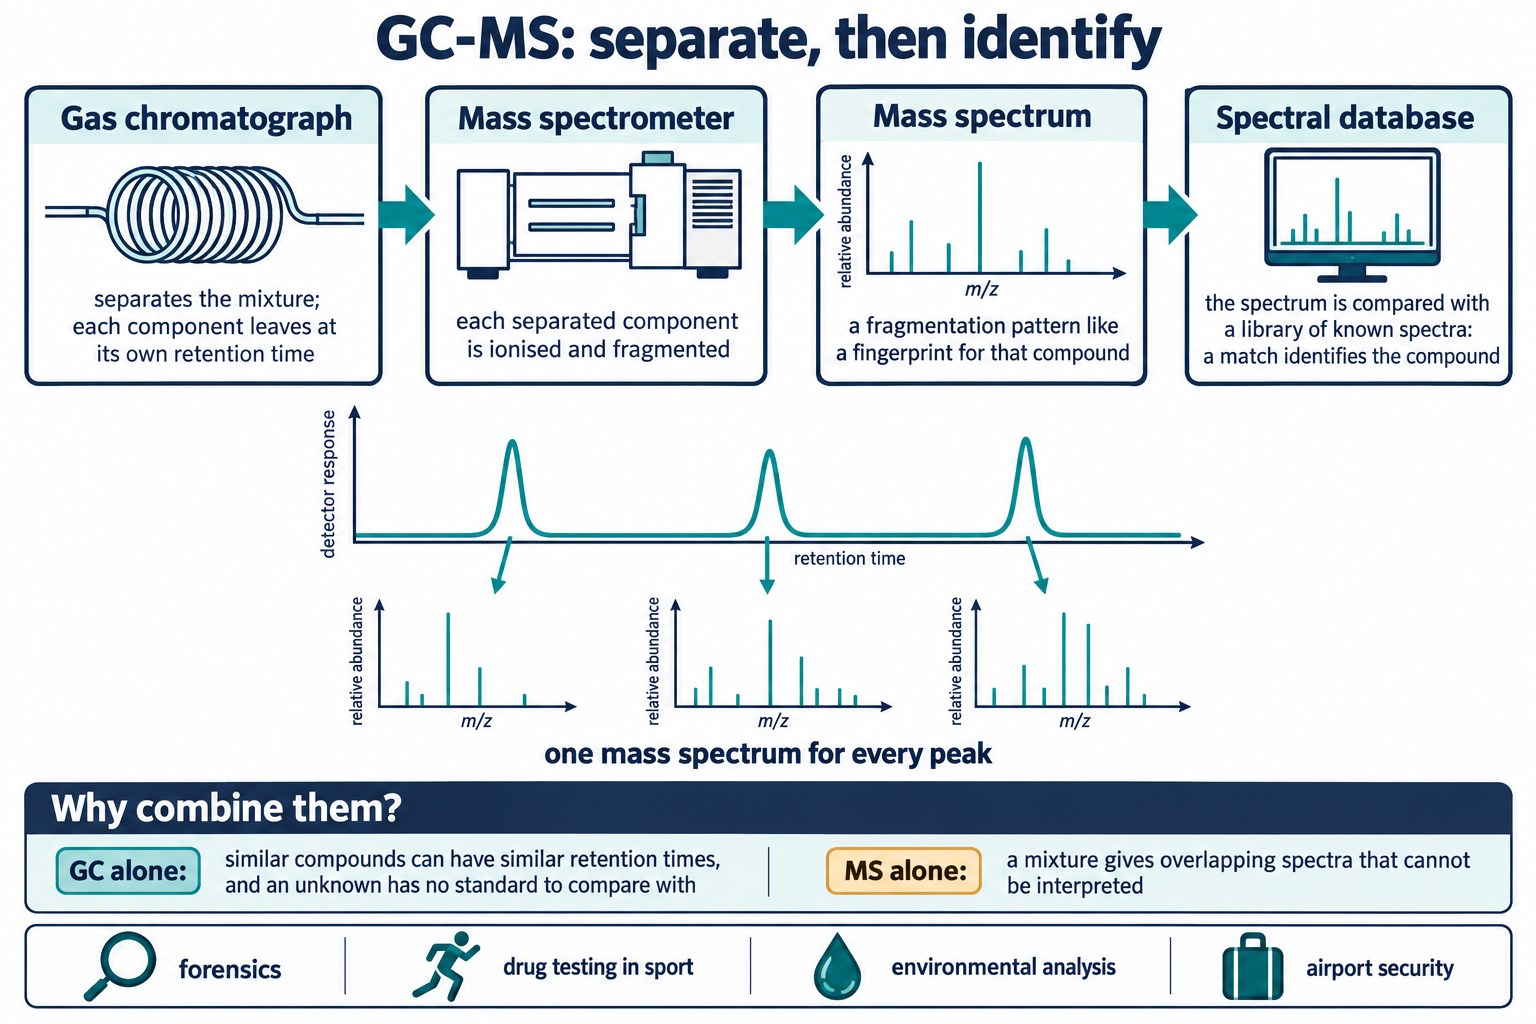
GC-MS: the chromatograph separates the mixture, the mass spectrometer records a spectrum for each component, and a database match identifies it.
Uses
| Use | Example |
|---|---|
| Forensics | identifying substances in samples from a crime scene or a fire |
| Drug testing in sport | detecting banned substances in blood or urine |
| Environmental analysis | measuring pollutants and pesticides in water, air and food |
| Airport security | detecting traces of explosives |
Key idea: Chromatography separates; mass spectrometry identifies. Together they can identify every component of a complex mixture, even in tiny amounts.
Quick Check: Why Add a Mass Spectrometer?
Pick the one accurate statement in each set, using new analytical problems.
Common Exam Points
Say
- “Retention time is the time from injection to detection of the component.”
- “The mobile phase is an inert carrier gas such as nitrogen or helium.”
- “The component is identified by comparing its retention time with that of a known substance under the same conditions.”
- “The area under each peak is proportional to the amount of that component.”
Do not say
- “The first peak is the largest molecule” (the first peak is the component least retained by the stationary phase).
- “The carrier gas reacts with the sample” (it is inert).
- “The tallest peak is the most abundant component” (compare areas, not heights).
Watch for
- Naming both phases correctly: gas mobile phase, liquid or solid stationary phase.
- GC-MS questions: say that GC separates and the mass spectrum identifies by comparison with a database.
- Stating that conditions must be kept the same when retention times are compared.
Check: Interpreting Chromatograms
Interpret gas chromatograms: identify components from retention times and find the percentage composition from peak areas, with data not used on this page.
FAQs
Use these quick answers to check gas chromatography and retention times.
What are the two phases in gas chromatography?
The mobile phase is an inert carrier gas such as nitrogen or helium. The stationary phase is a high-boiling liquid coated on a solid support inside a long coiled column, which is kept in an oven.
What is retention time?
It is the time from injection of the sample to the detection of a component at the end of the column. Components more soluble in the liquid stationary phase are held back for longer and so have longer retention times.
How is a component identified by gas chromatography?
Compare its retention time with that of a known standard run under exactly the same conditions: same column, temperature and carrier gas flow rate. Different compounds can have similar retention times, so a match is not absolute proof.
What does the area under a peak show?
The area is proportional to the amount of that component in the sample. Percentage composition = (area of one peak) / (total area of all peaks) × 100. Compare areas, not heights, because peaks can be broad or narrow.
Why is gas chromatography joined to mass spectrometry?
Chromatography separates the mixture, and each component then passes into a mass spectrometer. Its mass spectrum is compared with a database to identify it with certainty. The method is used in forensics, environmental analysis, airport security and drug testing in sport.
Copyright notice: This OLS revision content, including the explanations, layout, diagrams, tables and embedded learning structure, is authored for Online Learning System by Dr. Mohammed Al-Fatah. It may not be copied, reproduced, redistributed or adapted without written permission.
Keep this note — free
Save your progress across every OCR topic. A free account remembers which topics you have covered, saves your question scores, and syncs across your phone and laptop.
- Track every topic you have finished
- Keep your practice-question scores
- No payment, no card, free forever
Already registered? Log in