Proton NMR Spectroscopy
A concise revision guide to proton NMR: proton environments and chemical shift, relative peak areas, spin–spin splitting and the n + 1 rule, TMS and deuterated solvents, proton exchange with D₂O, and predicting or interpreting a high resolution spectrum.
- 6.3.2(b)(i)
- 6.3.2(b)(ii)
- 6.3.2(b)(iii)
- 6.3.2(b)(iv)
- 6.3.2(b)(v)
- 6.3.2(c)-ii
- 6.3.2(d)(i)
- 6.3.2(d)(ii)
- 6.3.2(d)(iii)-a
- 6.3.2(d)(iii)-b
- 6.3.2(e)(iv)
What these spec points say
- 6.3.2(b)(i) analysis of a high resolution proton NMR spectrum of an organic molecule to make predictions about the number of proton environments in the molecule
- 6.3.2(b)(ii) analysis of a high resolution proton NMR spectrum of an organic molecule to make predictions about the different types of proton environment present, from chemical shift values
- 6.3.2(b)(iii) analysis of a high resolution proton NMR spectrum of an organic molecule to make predictions about the relative numbers of each type of proton present from relative peak areas, using integration traces or ratio numbers, when required
- 6.3.2(b)(iv) analysis of a high resolution proton NMR spectrum of an organic molecule to make predictions about the number of non-equivalent protons adjacent to a given proton from the spin–spin splitting pattern, using the n + 1 rule
- 6.3.2(b)(v) analysis of a high resolution proton NMR spectrum of an organic molecule to make predictions about possible structures for the molecule
- 6.3.2(c)-ii prediction of a proton NMR spectrum for a given molecule
- 6.3.2(d)(i) the use of tetramethylsilane, TMS, as the standard for chemical shift measurements
- 6.3.2(d)(ii) the need for deuterated solvents, e.g. CDCl3, when running an NMR spectrum
- 6.3.2(d)(iii)-a the identification of O–H protons by proton exchange using D2O
- 6.3.2(d)(iii)-b the identification of N–H protons by proton exchange using D2O
- 6.3.2(e)(iv) deduction of the structures of organic compounds from different analytical data including NMR spectra
Proton NMR: Why Peaks Split (the n + 1 Rule)
See the two proton environments of chloroethane as single peaks, then watch each peak split as the spins of the neighbouring protons line up in different ways, and use the n + 1 rule to read a real spectrum.
© Dr. Mohammed Al-Fatah – onlinelearningsystem.net
Before You Start
This page follows Carbon-13 NMR Spectroscopy: chemical environments, chemical shift δ and TMS work in the same way here. Proton NMR adds two more pieces of evidence, peak areas and splitting.
Four Pieces of Information
A proton NMR (¹H NMR) spectrum shows the hydrogen atoms in a molecule. Hydrogen atoms in the same environment are equivalent and give one peak.
| Feature of the spectrum | What it shows |
|---|---|
| Number of peaks | the number of different proton environments |
| Chemical shift, δ | the type of environment each proton is in |
| Relative peak area (integration) | the relative number of protons in each environment |
| Splitting pattern | the number of protons on the adjacent carbon atom |
Counting proton environments
| Compound | Structure | Environments | Ratio of protons |
|---|---|---|---|
| Propanone | CH₃COCH₃ | 1 | all 6 equivalent |
| Ethanol | CH₃CH₂OH | 3 | 3 : 2 : 1 |
| Propanal | CH₃CH₂CHO | 3 | 3 : 2 : 1 |
| Ethyl ethanoate | CH₃COOCH₂CH₃ | 3 | 3 : 2 : 3 |
| Propan-2-ol | CH₃CH(OH)CH₃ | 3 | 6 : 1 : 1 |
Key idea: Hydrogen atoms on the same carbon are equivalent. Hydrogen atoms on different carbons are equivalent only if symmetry makes those carbons equivalent.
TMS and the Solvent
Why TMS is the standard
Chemical shifts are measured relative to tetramethylsilane (TMS), Si(CH₃)₄, which is given δ = 0.
- Its 12 hydrogen atoms are all equivalent, so it gives one sharp, strong peak.
- Its peak lies to the right of almost all other peaks, so it does not overlap them.
- It is inert, so it does not react with the sample.
- It is volatile, so it is easily removed afterwards, and it is non-toxic.
Why the solvent has no ¹H atoms
The sample is dissolved in a deuterated solvent such as CDCl₃. An ordinary solvent such as CHCl₃ would give its own large proton peak and hide the peaks of the sample.
- In CDCl₃ the hydrogen has been replaced by deuterium, ²H (D), which does not absorb in the ¹H NMR range.
- So the solvent adds no peaks to the spectrum.
Exam wording: “TMS gives a single peak because all twelve protons are equivalent; it is inert, volatile and non-toxic. CDCl₃ contains no ¹H atoms, so the solvent gives no peak.”
Chemical Shift and Peak Area
As in ¹³C NMR, a proton close to an electronegative atom or a C=O group has a larger δ value.
| Type of proton | Example | Typical δ / ppm |
|---|---|---|
| Alkyl, R–CH₃ or R–CH₂–R | CH₃ in ethanol | 0.7 to 1.6 |
| H–C–C=O | CH₃ in propanone | 2.0 to 2.9 |
| H–C–Cl or H–C–Br | CH₂ in chloroethane | 3.0 to 4.3 |
| H–C–O | CH₂ in ethanol or in an ethyl ester | 3.2 to 4.3 |
| H–C=C | alkene protons | 4.5 to 6.0 |
| H on a benzene ring | benzene | 6.5 to 8.0 |
| Aldehyde, –CHO | ethanal | 9.0 to 10.0 |
| Carboxylic acid, –COOH | ethanoic acid | 10.0 to 12.0 |
| Alcohol, O–H | ethanol | 0.5 to 5.0 (variable) |
Shift ranges are typical values and they overlap. Always use the data provided in the exam.
Integration: how many protons
The area under each peak is proportional to the number of protons in that environment. The spectrometer measures it as an integration trace or prints it as a number.
- The areas give a ratio, not the actual numbers. A ratio of 3 : 2 : 1 could mean 6, 4 and 2 protons.
- Use the molecular formula to turn the ratio into actual numbers of protons.
- Peak height alone is not reliable, because a split peak is spread over several lines.
Key idea: Chemical shift tells you the type of proton. Peak area tells you how many protons of that type there are.
Check: Environments, Shifts and Areas
Count proton environments, predict ratios of peak areas and use typical chemical shifts, for compounds not used on this page.
Spin–Spin Splitting and the n + 1 Rule
In a high resolution spectrum a peak is often split into several lines. The splitting is caused by the protons on the adjacent carbon atom. It is called spin–spin coupling.
The n + 1 rule: A peak is split into n + 1 lines, where n is the number of non-equivalent protons on the adjacent carbon atom.
| Protons on adjacent carbon, n | Lines, n + 1 | Name | Heights of lines |
|---|---|---|---|
| 0 | 1 | singlet | one line |
| 1 | 2 | doublet | 1 : 1 |
| 2 | 3 | triplet | 1 : 2 : 1 |
| 3 | 4 | quartet | 1 : 3 : 3 : 1 |
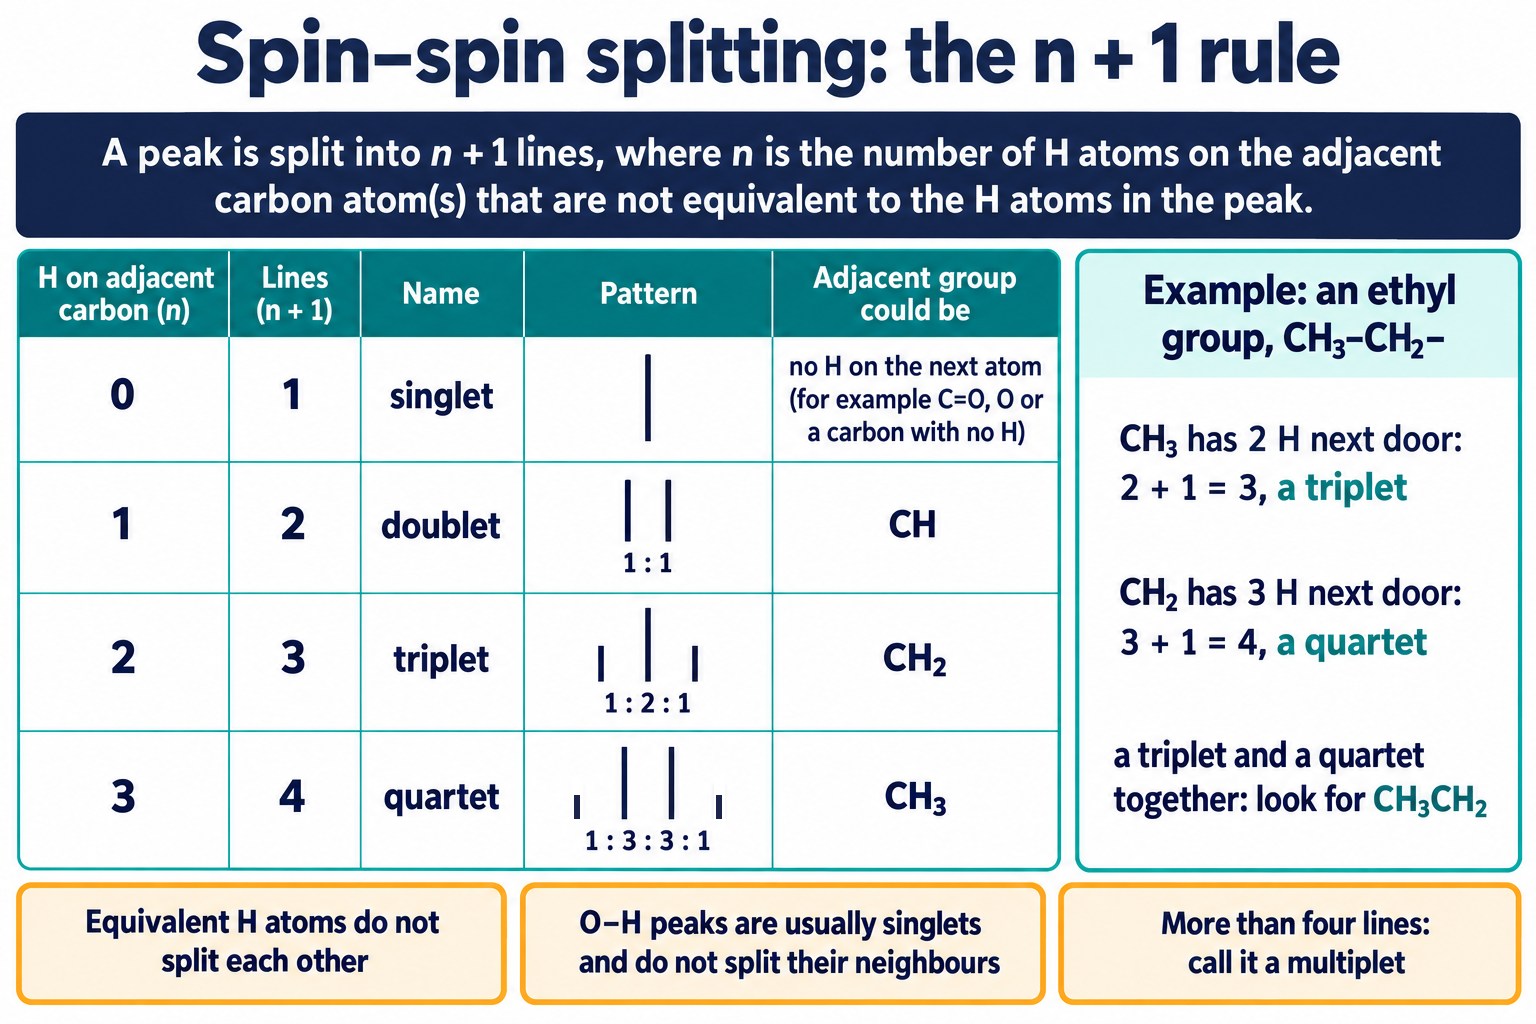
The n + 1 rule: singlet, doublet, triplet and quartet patterns with their line heights, and what each one says about the neighbouring carbon atom.
Rules for using it
- Splitting tells you about the neighbours, not about the protons giving the peak.
- Equivalent protons do not split each other. The six protons of propanone give a singlet.
- An O–H proton usually appears as a singlet, and it does not split the protons next to it.
- Protons separated by an atom with no hydrogen, such as the C=O carbon or an ester oxygen, do not split each other.
- A peak with more lines, or with neighbours on both sides, can be described as a multiplet.
The ethyl group pattern
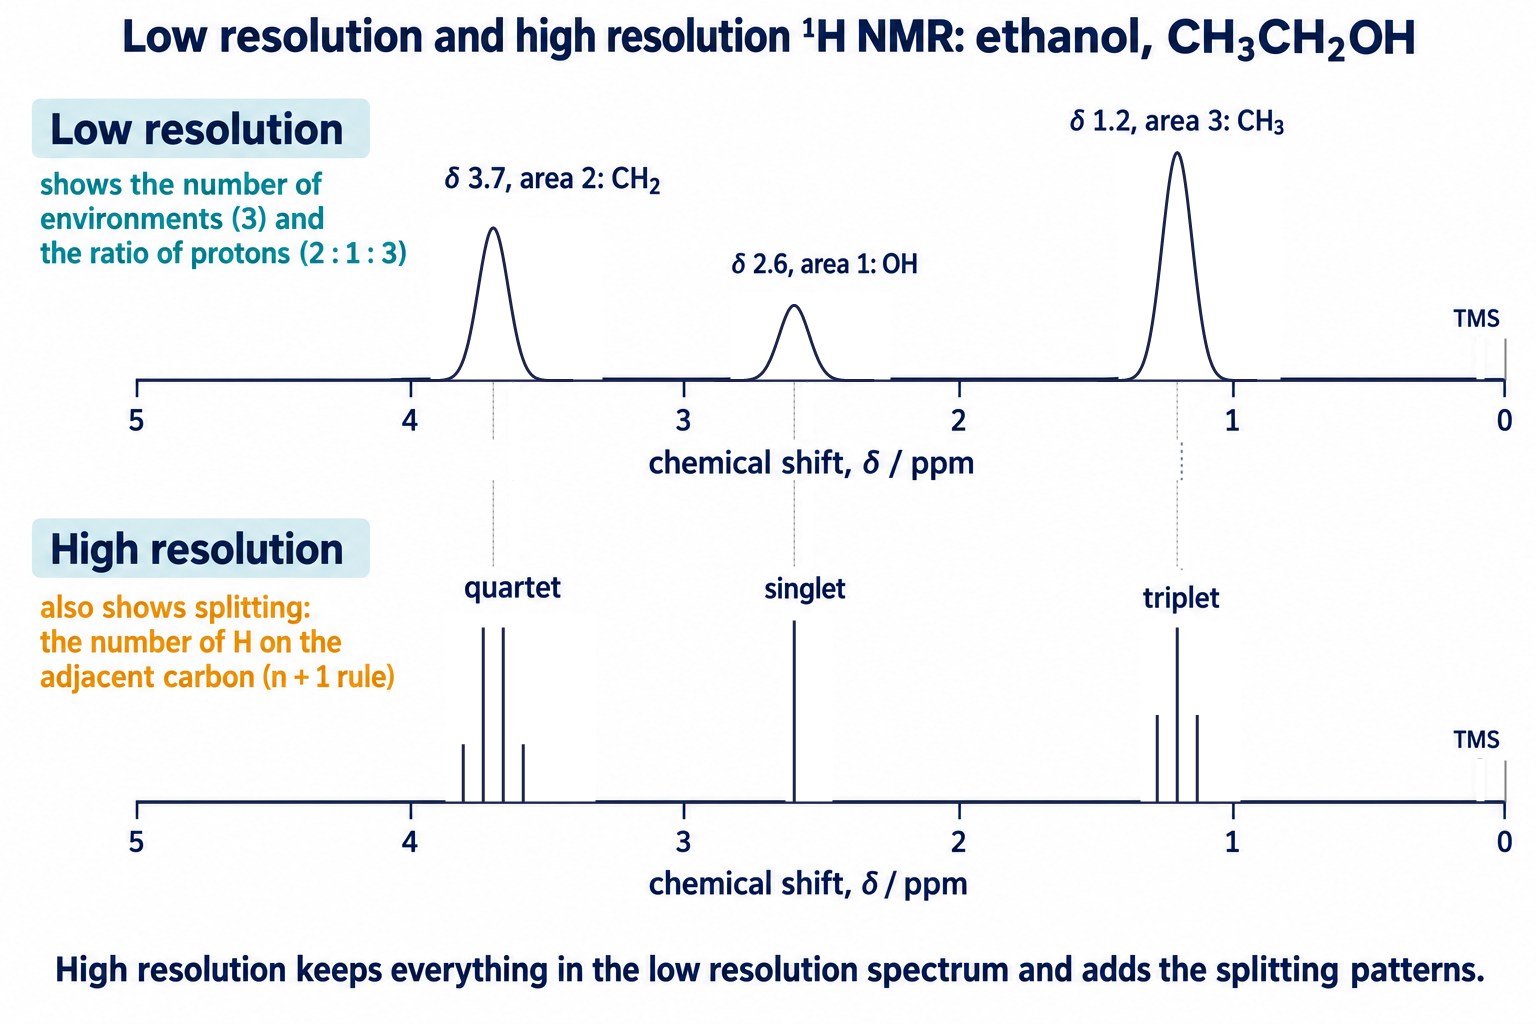
In CH₃CH₂– the CH₃ protons have two neighbours and form a triplet. The CH₂ protons have three neighbours and form a quartet. A triplet and a quartet together are the sign of an ethyl group.
Worked Examples: Ethanol and Ethyl Ethanoate
Ethanol, CH₃CH₂OH
| δ / ppm | Area | Splitting | Protons | Reason for the splitting |
|---|---|---|---|---|
| 1.2 | 3 | triplet | CH₃ | 2 protons on the adjacent CH₂: 2 + 1 = 3 |
| 3.7 | 2 | quartet | CH₂ | 3 protons on the adjacent CH₃: 3 + 1 = 4 |
| 2.6 | 1 | singlet | OH | O–H is not split |
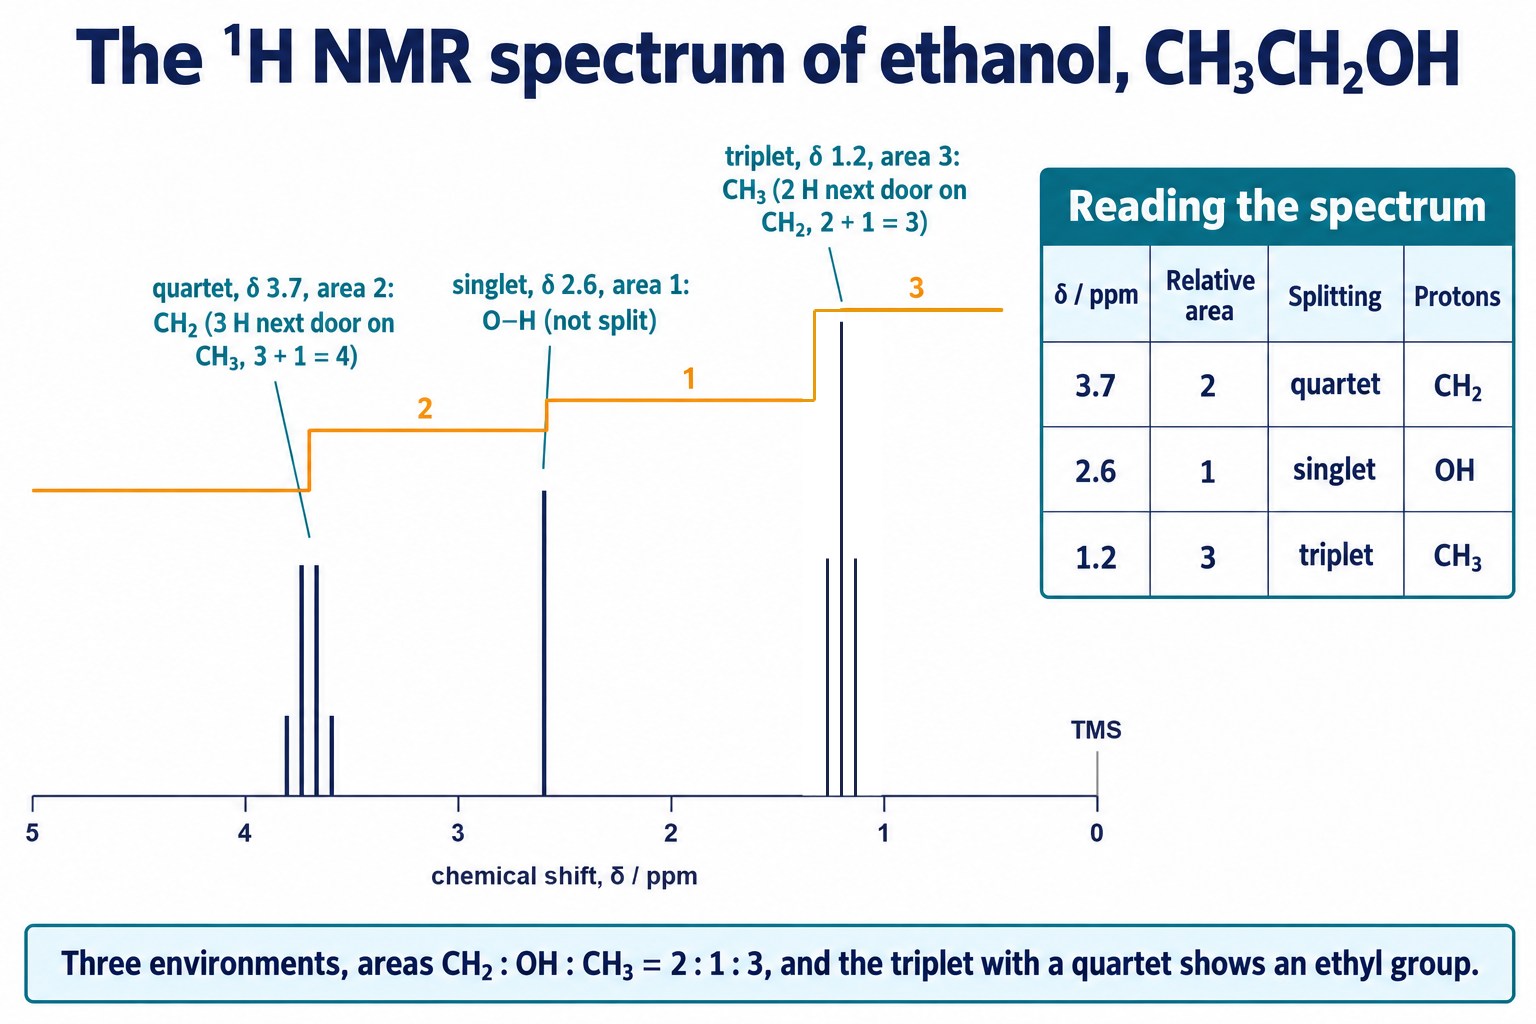
Sketch proton NMR spectrum of ethanol: a quartet at δ 3.7 (CH₂), a singlet at δ 2.6 (OH) and a triplet at δ 1.2 (CH₃), with areas 2 : 1 : 3.
Ethyl ethanoate, CH₃COOCH₂CH₃
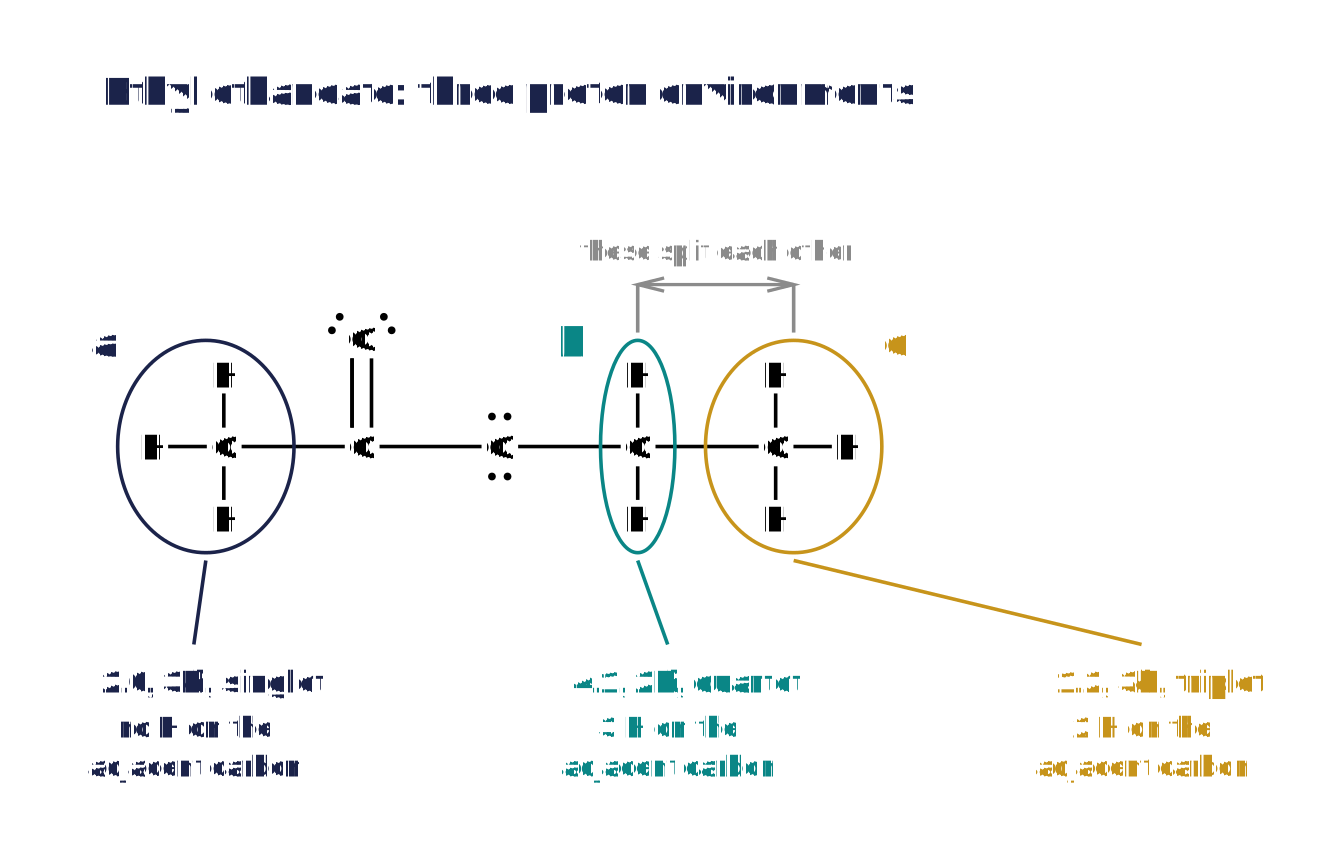
Ethyl ethanoate with its three proton environments ringed: a, the CH₃ next to C=O; b, the O–CH₂; c, the CH₃ of the ethyl group.
| Peak | δ / ppm | Area | Splitting | Protons | Reason |
|---|---|---|---|---|---|
| a | 2.0 | 3 | singlet | CH₃C=O | no protons on the adjacent carbon |
| b | 4.1 | 2 | quartet | O–CH₂ | 3 protons on the adjacent CH₃ |
| c | 1.2 | 3 | triplet | CH₃ | 2 protons on the adjacent CH₂ |
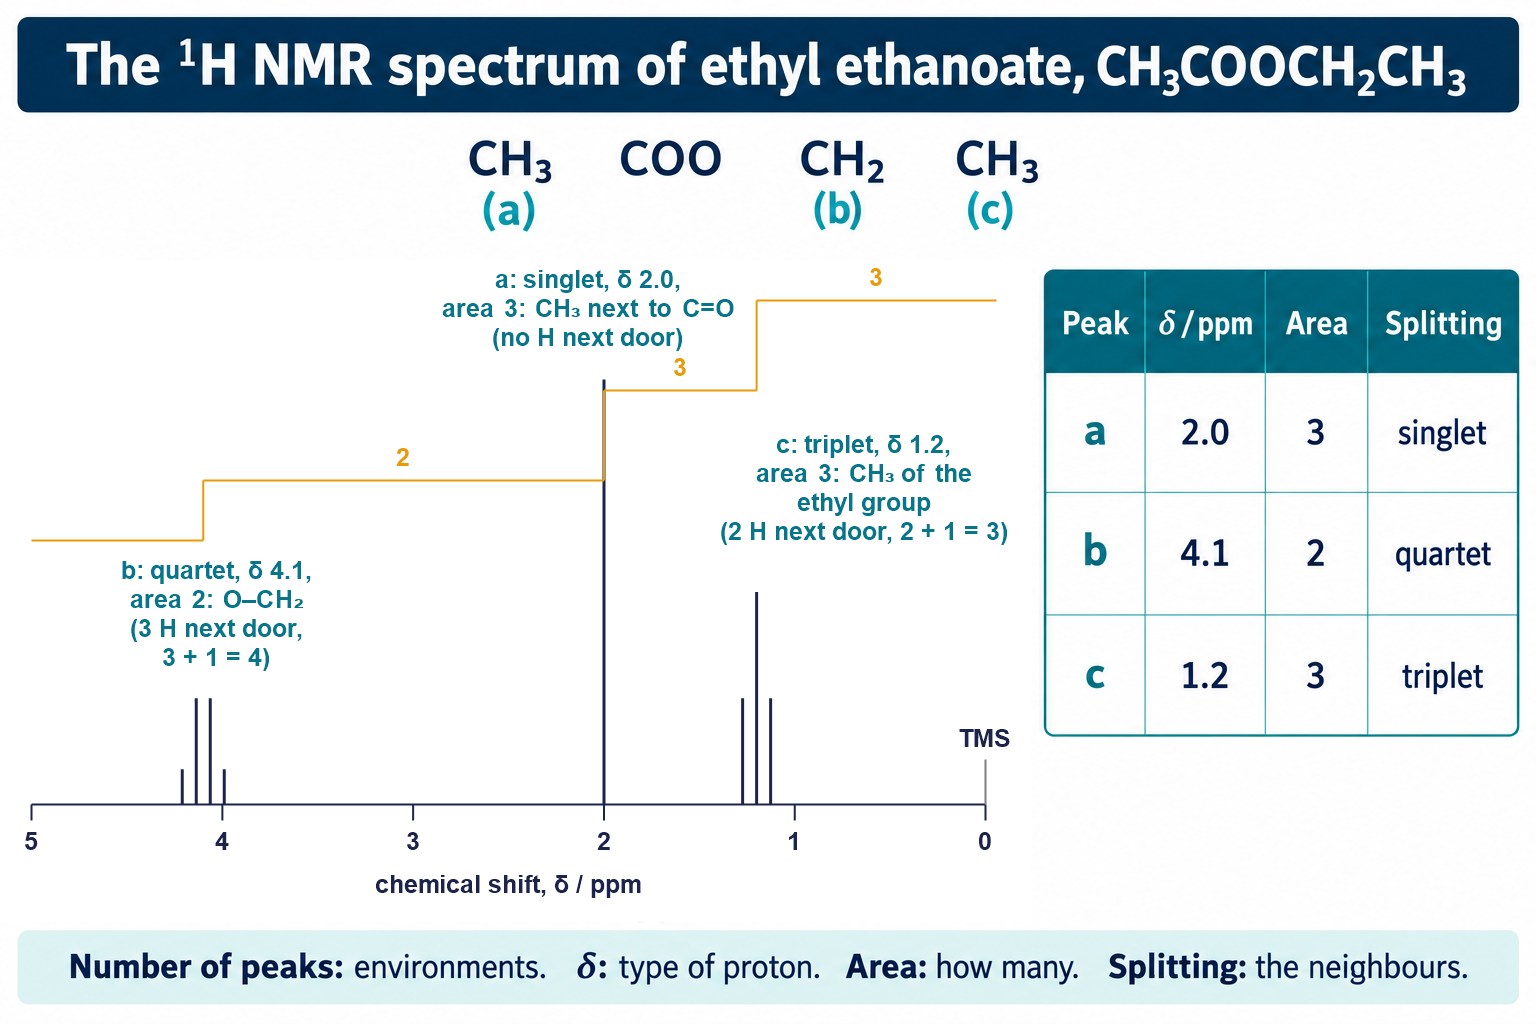
Sketch proton NMR spectrum of ethyl ethanoate: singlet a at δ 2.0, quartet b at δ 4.1 and triplet c at δ 1.2, with areas 3 : 2 : 3.
- Peak b is furthest left because its carbon is bonded directly to oxygen.
- Peak a is at δ 2.0 because its carbon is next to the C=O group.
Exam focus: Work through every peak in the same order: chemical shift, then area, then splitting. Write one line of reasoning for each.
Check: Splitting Patterns
Apply the n + 1 rule to predict or explain singlets, doublets, triplets and quartets, for compounds not used on this page.
Finding O–H and N–H Protons With D₂O
Peaks from O–H and N–H protons can appear over a wide range of δ and are often broad. This makes them hard to assign. Proton exchange with D₂O identifies them.
- Run the spectrum as normal.
- Add a few drops of D₂O (deuterium oxide) to the sample and shake.
- Run the spectrum again.
- Any peak that has disappeared was an O–H or N–H proton.
CH₃CH₂OH + D₂O ⇌ CH₃CH₂OD + HOD
- The O–H or N–H proton is exchanged for a deuterium atom.
- Deuterium does not absorb in the ¹H NMR range, so the peak disappears.
- Protons bonded to carbon are not exchanged, so their peaks are unchanged.
Proton NMR spectra of ethanol before and after shaking with D₂O: the O–H singlet at δ 2.6 disappears, while the CH₂ quartet and CH₃ triplet stay.
Exam wording: “Add D₂O and run the spectrum again. The peak that disappears is due to the O–H (or N–H) proton, because the proton is exchanged for deuterium.”
Predicting and Interpreting Spectra
Predicting a spectrum
- Find the proton environments: this is the number of peaks.
- Count the protons in each environment: this is the ratio of areas.
- Count the protons on the adjacent carbon atoms: add 1 for the splitting.
- Use the shift data to estimate δ for each peak.
| Compound | Peaks: δ, area, splitting |
|---|---|
| Propanone, CH₃COCH₃ | δ 2.2, 6H, singlet |
| Propanal, CH₃CH₂CHO | δ 9.8, 1H, triplet; δ 2.5, 2H, multiplet; δ 1.1, 3H, triplet |
| Butanone, CH₃COCH₂CH₃ | δ 2.1, 3H, singlet; δ 2.4, 2H, quartet; δ 1.0, 3H, triplet |
| 2-Chloropropane, CH₃CHClCH₃ | δ 1.5, 6H, doublet; δ 4.1, 1H, multiplet (7 lines) |
| Ethanoic acid, CH₃COOH | δ 2.1, 3H, singlet; δ 11.4, 1H, singlet |
In propanal the CH₂ protons have neighbours on both sides: three on CH₃ and one on CHO. Their peak is a multiplet.
Worked example: identifying an ester
An ester, C₄H₈O₂, has three peaks: δ 3.7 (3H, singlet), δ 2.3 (2H, quartet) and δ 1.1 (3H, triplet). Identify it.
Step 1. The triplet (3H) and quartet (2H) show an ethyl group, CH₃CH₂–.
Step 3. The singlet (3H) at δ 3.7 is a CH₃ bonded to oxygen, O–CH₃, with no protons on the adjacent atom.
Remember: Two isomers can have the same number of peaks, the same areas and the same splitting. The chemical shifts then decide between them.
Quick Check: Which Give Two Singlets?
Find the environments in each new compound, then decide whether each peak is split.
Combining Techniques
Exam questions often give several pieces of evidence for one unknown compound. Each technique answers a different question. The earlier techniques are covered in 4.2.4 Analytical techniques.
| Evidence | What it gives |
|---|---|
| Elemental analysis (percentage by mass) | the empirical formula |
| Mass spectrum | Mr from the molecular ion peak, so the molecular formula; fragments |
| Infrared spectrum | the bonds and functional groups present, such as O–H or C=O |
| ¹³C NMR spectrum | the number and types of carbon environments |
| ¹H NMR spectrum | proton environments, numbers of protons and their neighbours |
- Find the empirical formula, then the molecular formula using Mr.
- Use the infrared spectrum to name the functional groups.
- Use the NMR spectra to build the carbon skeleton.
- Check that the structure agrees with every piece of evidence.
Exam focus: Link each conclusion to its evidence: quote the m/z value, the wavenumber or the δ value that supports it.
Common Exam Points
Say
- “The peak is a quartet because there are three protons on the adjacent carbon atom (n + 1 = 4).”
- “The ratio of peak areas, 3 : 2 : 3, shows the relative number of protons in each environment.”
- “TMS is the standard: all its protons are equivalent, so it gives one peak at δ = 0.”
- “The O–H peak disappears when D₂O is added.”
Do not say
- “The peak is a triplet because it has three protons” (splitting comes from the neighbours).
- “The O–H proton splits the CH₂ peak” (O–H protons are not involved in splitting here).
- “The tallest peak has the most protons” (use the area, not the height).
Watch for
- A singlet of area 3 near δ 2: often CH₃ next to C=O. Near δ 3.7: often O–CH₃.
- A doublet of area 6 with a 1H multiplet: a (CH₃)₂CH– group.
- Peaks above δ 9: an aldehyde or carboxylic acid proton.
Check: Interpreting Proton NMR Spectra
Use chemical shifts, peak areas and splitting patterns together to identify compounds and assign every peak, for spectra not used on this page.
FAQs
Use these quick answers to check proton NMR spectra, splitting patterns and TMS.
What does a ¹H NMR spectrum tell me?
The number of peaks gives the number of proton environments, chemical shift gives the type of environment, the relative peak areas give the ratio of protons in each, and the splitting pattern gives the number of protons on adjacent carbon atoms.
How does the n + 1 rule work?
A peak is split into n + 1 by n non-equivalent protons on adjacent carbon atoms. Protons next to CH₃ give a quartet, next to CH₂ a triplet, next to CH a doublet, and with no neighbours a singlet.
Why is TMS used as the standard?
Tetramethylsilane, Si(CH₃)₄, has twelve equivalent protons, so it gives one sharp, strong peak, defined as δ = 0, away from most other peaks. It is also inert, non-toxic and volatile, so it is easily removed afterwards.
Why is the sample dissolved in CDCl₃?
An ordinary solvent contains ¹H atoms and would give its own large peaks. In a deuterated solvent such as CDCl₃ the hydrogen is replaced by deuterium, which gives no peak in the ¹H spectrum.
What does shaking the sample with D₂O show?
Protons in OH and NH groups exchange with deuterium from D₂O, and deuterium gives no ¹H signal. When the spectrum is run again, the peak that has disappeared must have come from an OH or NH proton.
Copyright notice: This OLS revision content, including the explanations, layout, diagrams, tables and embedded learning structure, is authored for Online Learning System by Dr. Mohammed Al-Fatah. It may not be copied, reproduced, redistributed or adapted without written permission.
Keep this note — free
Save your progress across every OCR topic. A free account remembers which topics you have covered, saves your question scores, and syncs across your phone and laptop.
- Track every topic you have finished
- Keep your practice-question scores
- No payment, no card, free forever
Already registered? Log in