Infrared Spectroscopy
A concise revision guide to infrared spectroscopy: why bonds absorb infrared radiation, wavenumbers and transmittance, the characteristic absorptions of C–H, C=C, C=O, O–H, N–H and C–X bonds, the fingerprint region, and the link to greenhouse gases.
- 3.3.6.3i
- 3.3.6.3ii
- 3.3.6.3iii-a
- 3.3.6.3iii-b
- 3.3.6.3iv-a
- 3.3.6.3iv-b
- 3.3.6.3iv-c
What these spec points say
- 3.3.6.3i know that bonds in a molecule absorb infrared radiation at characteristic wavenumbers
- 3.3.6.3ii know that fingerprinting allows identification of a molecule by comparison of spectra
- 3.3.6.3iii-a use infrared spectra and the Chemistry Data Sheet to identify particular bonds
- 3.3.6.3iii-b use infrared spectra and the Chemistry Data Sheet to identify functional groups
- 3.3.6.3iv-a know the link between absorption of infrared radiation by bonds in CO2 and global warming
- 3.3.6.3iv-b know the link between absorption of infrared radiation by bonds in methane and global warming
- 3.3.6.3iv-c know the link between absorption of infrared radiation by bonds in water vapour and global warming
GCSE Recap: Bonds and Energy
Three quick questions on covalent bonds, the electromagnetic spectrum and why greenhouse gases warm the atmosphere.
Why Bonds Absorb Infrared
The atoms joined by a covalent bond are always vibrating: the bond stretches and compresses, and the angles between bonds bend.
Each vibration has its own natural frequency, which depends on the masses of the atoms and the strength of the bond.
When infrared radiation of that same frequency passes through the sample, the bond absorbs it and vibrates more energetically. An infrared spectrometer records which frequencies are absorbed, so the spectrum shows which bonds are present.
The frequency is given as a wavenumber in cm⁻¹ (the number of waves per centimetre), plotted from about 4000 on the left to 500 on the right.
The y-axis is transmittance, the percentage of the radiation that passes through, so an absorption appears as a trough pointing downwards.
Stronger bonds and lighter atoms vibrate faster and absorb at higher wavenumbers: O–H and N–H absorb near 3300 cm⁻¹, C=O near 1700 cm⁻¹, and C–Cl near 700 cm⁻¹.
Infrared Spectroscopy: Bonds That Vibrate
Choose a molecule: each bond stretches in turn, then the molecule bends, and the matching trough lights up on its infrared spectrum.
© Dr. Mohammed Al-Fatah – onlinelearningsystem.net
Key idea: A bond absorbs infrared radiation at the frequency of its own vibration. The wavenumber of the trough identifies the bond.
Characteristic Absorptions
The region above 1500 cm⁻¹ is used for functional group identification, because the absorptions there belong to particular bonds and are found in a data booklet. The exam provides the table; the skill is to match each trough to a bond and to give the range in the answer.
| Bond | Where it is found | Wavenumber / cm⁻¹ | Appearance |
|---|---|---|---|
| C–H | alkanes, alkenes, aldehydes, almost every organic compound | 2850–3100 | sharp, medium |
| C=C | alkenes | 1620–1680 | medium |
| C=O | aldehydes, ketones, carboxylic acids, esters | 1680–1750 | strong, sharp |
| O–H | alcohols | 3200–3600 | broad |
| O–H | carboxylic acids | 2500–3300 | very broad, overlaps C–H |
| N–H | amines | 3300–3500 | medium, often two peaks |
| C–O | alcohols, acids, esters | 1000–1300 | strong |
| C–X | halogenoalkanes: C–Cl, C–Br | 600–800 (C–Cl), 500–600 (C–Br) | in the fingerprint region |
The O–H absorptions are broad because hydrogen bonding between molecules spreads the vibration over a range of frequencies; a carboxylic acid O–H is the broadest of all and runs into the C–H region.
An alcohol shows a broad O–H near 3350 and no C=O; a carboxylic acid shows both a very broad O–H and a strong C=O near 1715; an aldehyde or ketone shows the C=O but no O–H.
An alkene’s C=C is weaker than a C=O and is easy to miss.
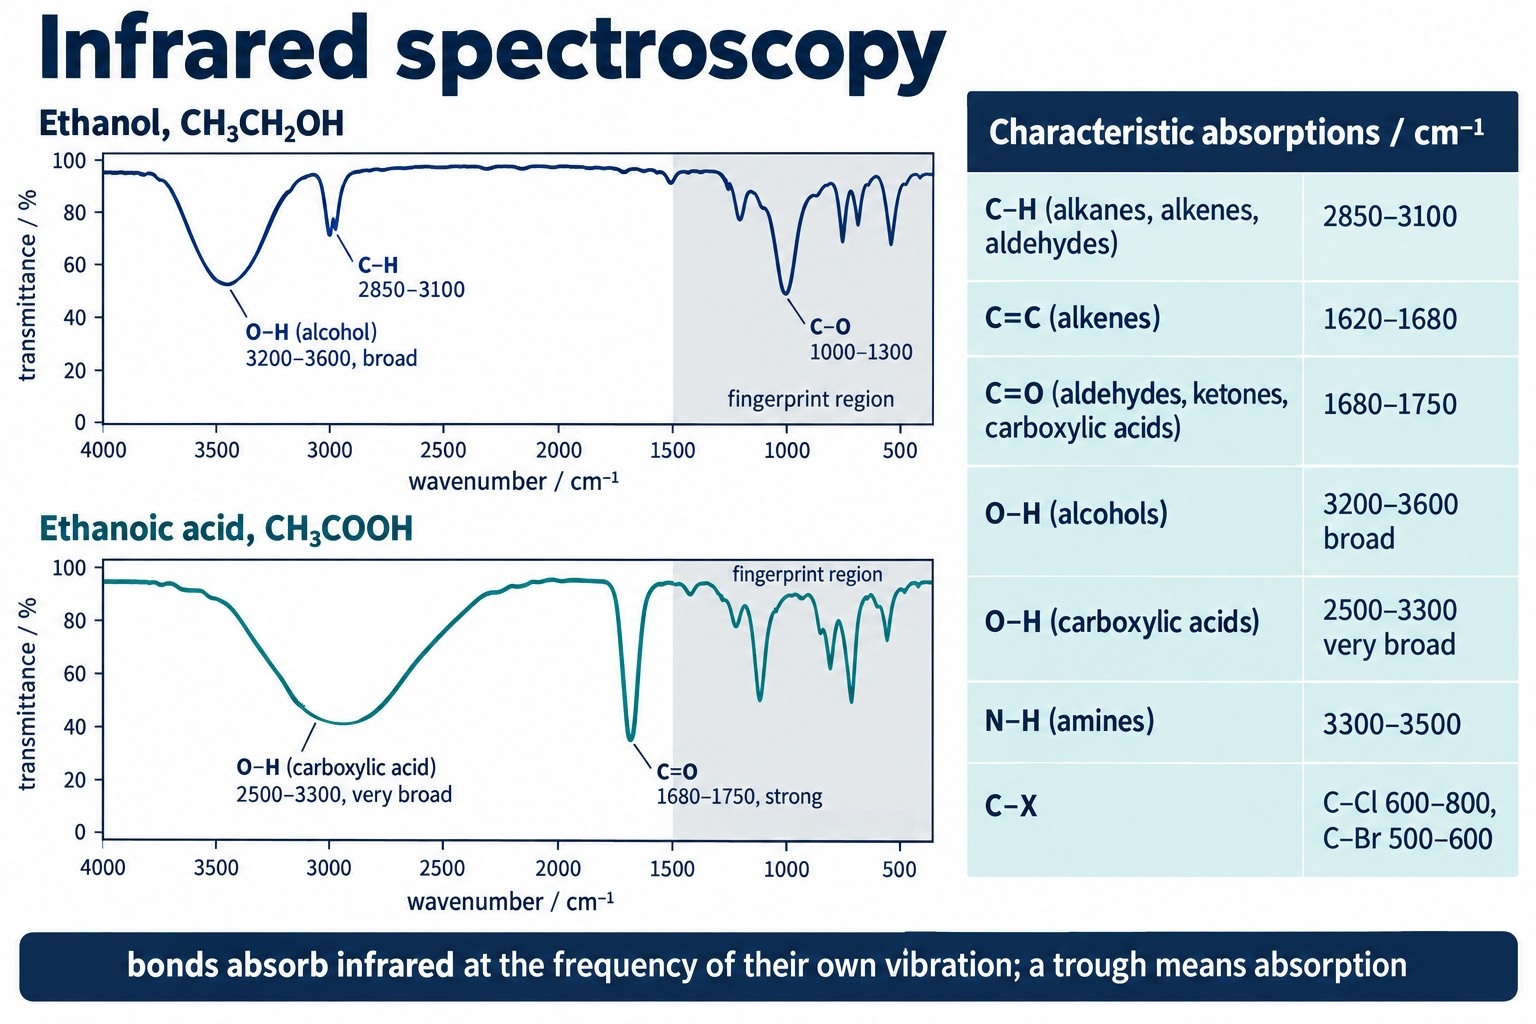
The infrared spectra of ethanol and ethanoic acid with the O–H, C=O, C–H and C–O absorptions labelled and the fingerprint region shaded, beside the wavenumber table.
Exam focus: Write “absorption at 1680–1750 cm⁻¹ due to C=O”. The bond, the range from the data sheet and the word absorption (or trough) are the three parts of the mark.
Check: Which Bond, Which Trough
Assign absorptions in spectra of compounds not discussed on this page.
The Fingerprint Region
Below about 1500 cm⁻¹ the spectrum contains many overlapping absorptions from bending vibrations and from C–C and C–O stretches.
This fingerprint region is too complicated to assign bond by bond, but its exact pattern is unique to each compound.
A computer compares the fingerprint region of an unknown with a database of spectra of pure compounds; an exact match identifies the compound and confirms its purity.
The same idea detects impurities: an extra absorption that the pure compound does not show, such as a C=O trough in a sample of an alcohol, reveals that some of the alcohol has been oxidised. Infrared spectroscopy therefore checks both what a product is and how pure it is.
Key idea: Above 1500 cm⁻¹: identify the functional groups. Below 1500 cm⁻¹: match the fingerprint to a database.
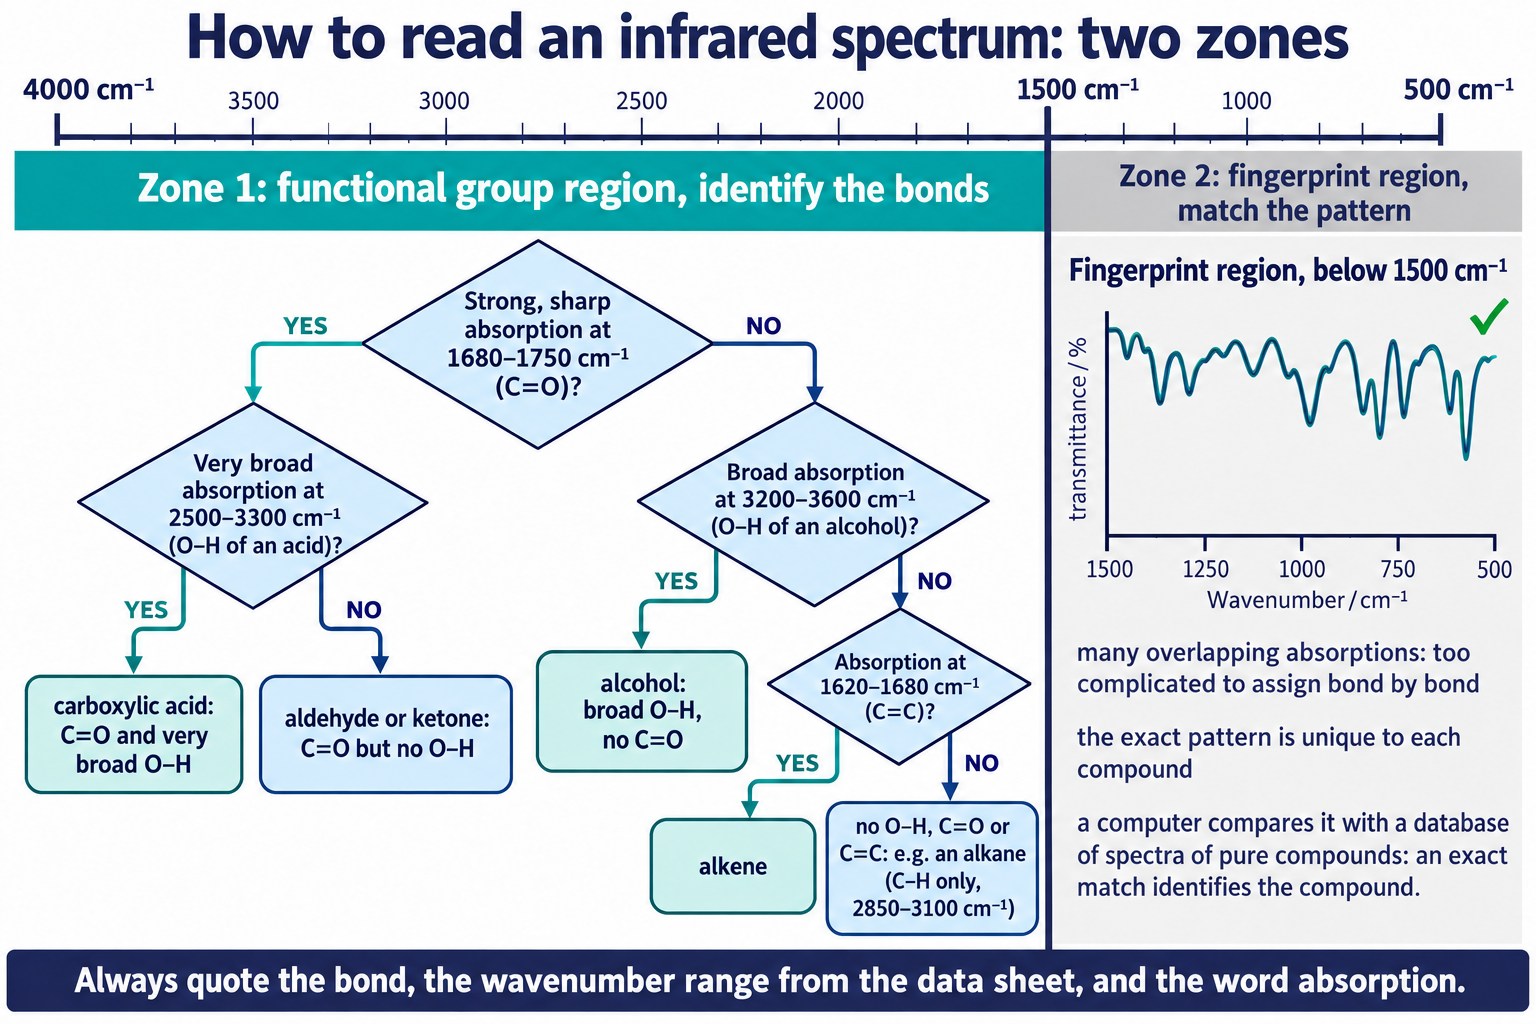
Use the absorptions above 1500 cm⁻¹ to decide the functional group, then match the fingerprint region below 1500 cm⁻¹ against a database to identify the compound.
Check: Telling Compounds Apart
Use spectra to distinguish between compounds that are not the examples above.
Infrared in the Atmosphere
The same absorptions that make infrared spectroscopy useful cause the greenhouse effect. The Sun warms the Earth’s surface, which radiates the energy back as infrared.
The C=O bonds in carbon dioxide, the O–H bonds in water vapour and the C–H bonds in methane absorb some of that infrared, vibrate more energetically and pass the energy to other molecules by collision.
The atmosphere is warmed instead of the energy escaping to space. Water vapour is the largest natural contributor.
The rise in carbon dioxide from burning fossil fuels is thought to be the main cause of global warming, which has driven changes in energy use towards renewable sources and greater efficiency.
Exam wording: “Infrared radiation emitted by the Earth is absorbed by the C=O bonds in CO₂ (and O–H in H₂O, C–H in CH₄), making the bonds vibrate; the energy is re-radiated or passed on by collisions and warms the atmosphere.”
Common Exam Points
Say
“A broad absorption at 3200–3600 cm⁻¹ shows an O–H group in an alcohol.” “No absorption at 1680–1750 cm⁻¹, so no C=O bond.” “The fingerprint region matches the database spectrum of the pure compound.”
Do not say
“A peak at 1700” (say absorption or trough, and quote the range). “The O–H peak” without saying alcohol or acid.
Watch for
Distinguishing questions: name the absorption that one compound has and the other lacks, with the wavenumber range.
Check: Predicting a Spectrum
Predict the absorptions of compounds not shown on this page.
FAQs
Use these quick answers to check infrared spectroscopy.
Why does the spectrum have troughs rather than peaks?
The y-axis is transmittance, the fraction of radiation that gets through. Where a bond absorbs, less radiation is transmitted, so the line dips.
Why is the O–H absorption broad?
Hydrogen bonding between molecules varies the strength of each O–H bond slightly, so the vibrations are spread over a range of wavenumbers. Carboxylic acids hydrogen bond most strongly and give the broadest band.
Can I tell an aldehyde from a ketone by infrared?
Not reliably. Both show the C=O absorption near 1700 cm⁻¹. Use the mass spectrum or a chemical test such as Tollens’ reagent or Fehling’s solution.
What is the fingerprint region for?
Matching. Below 1500 cm⁻¹ the pattern is unique to each compound, so comparing it with a database spectrum identifies the compound and shows whether it is pure.
Do I have to remember the wavenumbers?
No. The exam gives a data sheet; the skill is to look up the right bond and quote the range in your answer.
Copyright and author footprint: This OLS revision page was written for Online Learning System by Dr. Mohammed Al-Fatah. It is designed for A Level Chemistry revision and should not be copied or redistributed without permission.
Keep this note — free
Save your progress across every AQA topic. A free account remembers which topics you have covered, saves your question scores, and syncs across your phone and laptop.
- Track every topic you have finished
- Keep your practice-question scores
- No payment, no card, free forever
Already registered? Log in