Required Practical 3: Effect of Temperature on the Rate of Reaction
A focused revision guide to measuring rates of reaction for AQA A Level Chemistry: the disappearing cross at different temperatures and concentrations, why rate is proportional to 1/t, the Maxwell–Boltzmann distribution explanation, continuous monitoring by gas volume and loss of mass, and rate from the gradient of a tangent.
GCSE Recap: What Makes a Reaction Faster
Three quick questions on the GCSE rate ideas this practical builds on: the factors that change a rate, mean rate from a measurement and reading rate from a graph.
What This Practical Is Testing
This practical, Required Practical 3 on the AQA course, measures how the rate of reaction changes when one condition is changed and everything else is kept the same.
Rate is the change in the amount or concentration of a reactant or product per unit time.
The main experiment times the reaction between sodium thiosulfate and hydrochloric acid at five temperatures: the solution slowly fills with a pale yellow precipitate of sulfur until a cross drawn under the flask can no longer be seen.
Na₂S₂O₃(aq) + 2HCl(aq) → 2NaCl(aq) + S(s) + SO₂(g) + H₂O(l)
S₂O₃²⁻(aq) + 2H⁺(aq) → S(s) + SO₂(g) + H₂O(l)
The practical endorsement asks for “an investigation of how the rate of a reaction changes with temperature”, and the specification suggests the reaction of sodium thiosulfate with hydrochloric acid by an initial rate method.
The written papers then use the same experiment to test the meaning of rate, the effect of temperature and the Maxwell–Boltzmann explanation of why a small temperature rise gives a large rise in rate (3.1.5.3).
The specification also suggests following calcium carbonate and hydrochloric acid by a continuous monitoring method to see the effect of acid concentration (3.1.5.4), so both methods are on this page.
Measuring orders and rate constants by these two methods comes later in the course.
On the AQA course this practical is examined through the written papers (at least 15% of the marks test practical skills) and the practical endorsement.
The specification references are 3.1.5.3 (effect of temperature on reaction rate), with 3.1.5.4 (concentration and pressure) and 3.1.5.5 (catalysts).
Questions ask you to justify each step of the method, explain why 1/t is a measure of rate, process results into a table and graph, draw a tangent and find its gradient, explain the results with the Maxwell–Boltzmann distribution, and classify the errors.
The timing idea is the same one used in Practical Skills: Rates of Hydrolysis (hydrolysis of halogenoalkanes), where the time for a precipitate to appear compares three halogenoalkanes.
Key idea: Rate = change in amount (or concentration) ÷ time. When the same fixed amount of product is formed in every run, rate is proportional to 1/t.
Safety and Apparatus
The apparatus is simple, which is why examiners concentrate on how it is used. Each item has a job, and the precision of the measuring equipment decides the uncertainty in the final answer.
| Item | What it is for | Precision |
|---|---|---|
| 100 cm³ conical flask | Holds the reaction mixture over the cross; the same flask is used every run so the depth of liquid is the same | not a measuring vessel |
| 50 cm³ measuring cylinder | Measures the sodium thiosulfate solution (and water in the concentration version) | ±0.5 cm³ |
| 10 cm³ measuring cylinder | Measures 5.0 cm³ of hydrochloric acid | ±0.1 cm³ |
| White card with a pencil cross | The fixed end point: the moment the cross is no longer visible from above | same card and cross every run |
| Stopwatch | Times from the moment the acid is added to the moment the cross disappears | reads to 0.01 s, but the end point can only be judged to about ±1 s |
| Thermometer | Measures the temperature at the start and at the end of each run | ±0.5 °C per reading for a thermometer marked in 1 °C |
| Water bath (beaker of hot water or thermostatic bath) | Brings the thiosulfate solution to each temperature before the acid is added | temperature read on the thermometer, not the bath dial |
Safety: The reaction gives off sulfur dioxide, which is toxic and can trigger an asthma attack.
Work in a well-ventilated room, do not heat the mixture above about 60 °C (more SO₂ escapes from hot solution), and pour each finished mixture away promptly as your teacher directs.
Hydrochloric acid at 2.0 mol dm⁻³ is an irritant: wear eye protection.
Method: Step by Step
The method below is for the temperature investigation. The mixture must reach the chosen temperature before the reaction starts, and the reaction starts only when the acid goes in, so it is the thiosulfate solution that is warmed.
| Step | What you do | Why |
|---|---|---|
| Draw the cross | Draw a bold cross in pencil on a white card and use the same card for every run. | The end point is “the cross can no longer be seen”, so the cross must be identical every time. |
| Measure the thiosulfate | Measure 50 cm³ of 0.10 mol dm⁻³ sodium thiosulfate solution into the 100 cm³ conical flask. | The same volume in the same flask gives the same depth of liquid to look through. |
| Warm it | Stand the flask in a water bath until the solution is a little above the target temperature. | The 5.0 cm³ of cooler acid lowers the temperature slightly when it is added. |
| Start temperature | Put the flask on the cross and record the temperature of the solution. | The mixture cools during the run, so a start and an end reading are needed. |
| Add the acid | Add 5.0 cm³ of 2.0 mol dm⁻³ hydrochloric acid, start the stopwatch at the same moment and swirl the flask once. | Timing must begin when the reaction begins; one swirl mixes the solutions the same way every run. |
| Watch from above | Look straight down through the liquid at the cross. | The same viewing angle and depth of liquid every run keeps the end point consistent. |
| Stop the clock | Stop the stopwatch as soon as the cross can no longer be seen and record the time to the nearest second. | The end point cannot be judged more precisely than about a second. |
| End temperature | Record the temperature again and calculate the mean of the start and end values. | The mean is the best estimate of the temperature at which the reaction happened. |
| Repeat | Repeat at about 30, 40, 50 and 60 °C, and repeat each temperature if time allows. | Five temperatures spread over the range give a reliable curve; repeats reduce random error. |
Rates of Reaction: Disappearing Cross and Continuous Monitoring
Watch sulfur hide a pencil cross at five temperatures, then follow a reaction on a balance and in a gas syringe, and turn every result into a rate.
© Dr. Mohammed Al-Fatah – onlinelearningsystem.net
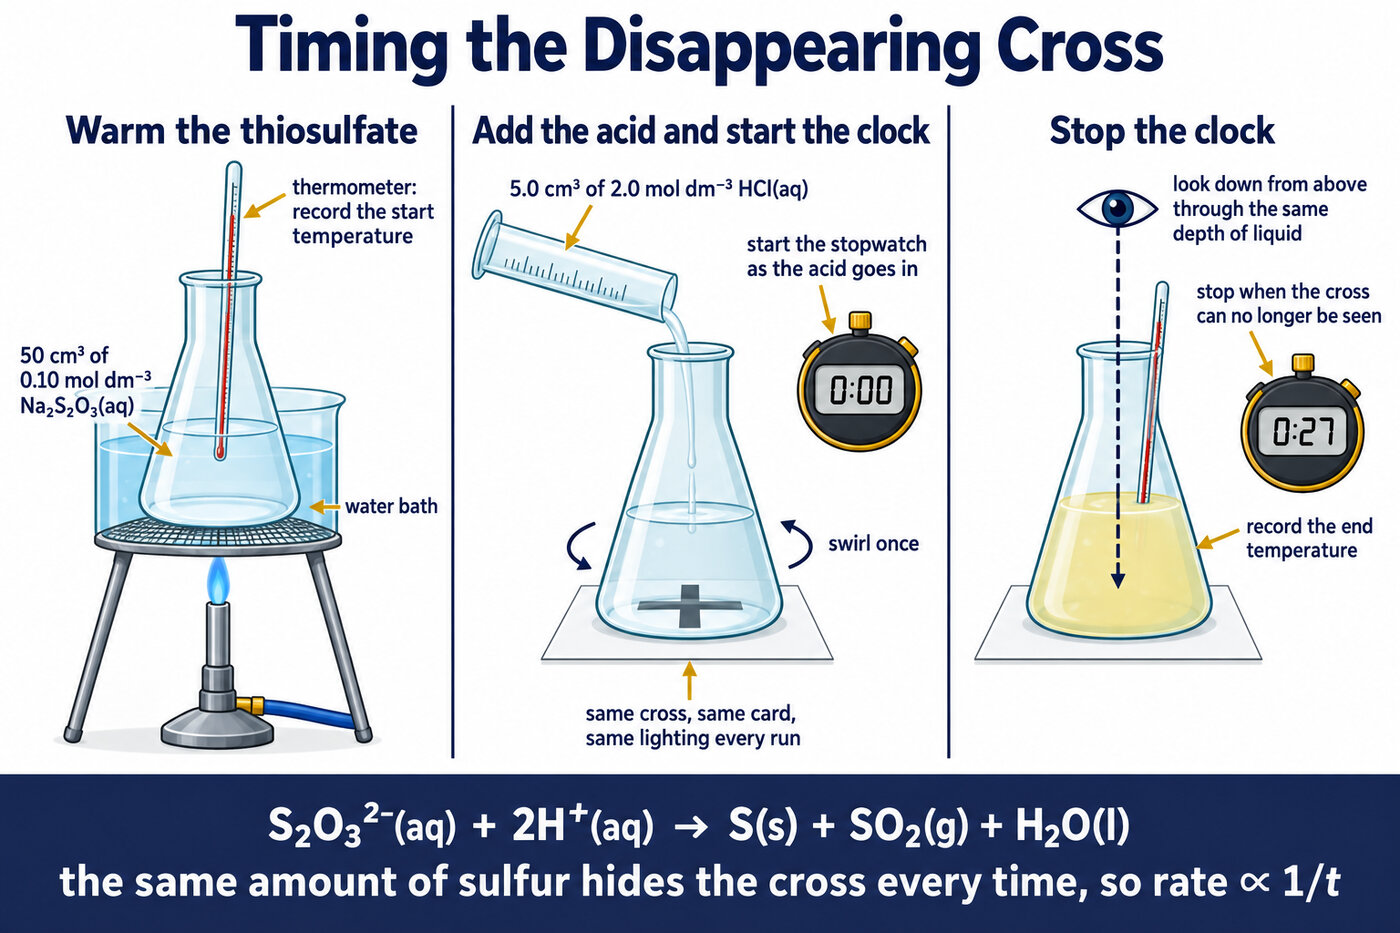
The disappearing cross method: warm the thiosulfate, add the acid and start the clock, then stop the clock when the cross can no longer be seen from above.
Technique point: Swirl once, then leave the flask still on the card. Moving the flask between looks changes the depth and angle, and the end point is lost.
Check: Planning a Timing Experiment
Order the method for a different reaction that is timed in the same way.
Why 1/t Measures the Rate
The cross disappears when a certain fixed amount of sulfur has formed in the liquid above it.
The flask, the volume, the cross and the viewing position are the same in every run, so the same amount of sulfur is needed every time.
Rate is amount formed divided by time, so when the amount is fixed, rate is proportional to 1/t: halve the time and the rate has doubled.
rate = amount of sulfur needed ÷ t, and the amount is constant, so rate ∝ 1/t
This makes the disappearing cross an initial rate method. The cross is hidden when only a small fraction of the thiosulfate has reacted.
The concentrations are still close to their starting values, so 1/t measures the rate at the start of the reaction. The value of 1/t has the unit s⁻¹.
It is a relative rate: it compares one run with another but does not give the rate in mol dm⁻³ s⁻¹, because the amount of sulfur that hides the cross is not known.
The same argument applies to any “time for an observation” experiment: a fixed amount of precipitate, a fixed colour, or a fixed volume of gas.
It fails if the amount is not fixed, for example if a different flask, a thicker cross or a different depth of liquid is used for some runs.
Exam wording: “The same amount of sulfur is formed each time the cross disappears, so rate = amount ÷ time is proportional to 1/t.”
Check: Turning Times Into Rates
Convert times into rates for a different reaction that is timed to a fixed amount of product.
Results: the Effect of Temperature
The table gives a complete set of results for the temperature investigation. The mixtures cooled during the run, most at the highest temperatures, so the mean temperature is the value plotted.
The times are recorded to the nearest second, the precision of the end point, and 1/t is given to three significant figures.
| Run | Start temperature / °C | End temperature / °C | Mean temperature / °C | Time t / s | 1/t / s⁻¹ |
|---|---|---|---|---|---|
| 1 | 21.0 | 21.0 | 21.0 | 88 | 0.0114 |
| 2 | 31.5 | 29.5 | 30.5 | 49 | 0.0204 |
| 3 | 42.0 | 38.0 | 40.0 | 27 | 0.0370 |
| 4 | 52.5 | 46.5 | 49.5 | 15 | 0.0667 |
| 5 | 63.0 | 55.0 | 59.0 | 9 | 0.111 |
The rate increases with temperature, and it increases by a larger amount for each step up.
From 21.0 °C to 30.5 °C the value of 1/t rises by a factor of 0.0204 ÷ 0.0114 = 1.8, and it rises by about the same factor for each further 10 °C.
So the graph of 1/t against temperature is a curve that becomes steeper, not a straight line.
A rise of about 10 °C roughly doubles the rate of many reactions near room temperature; here the factor is 1.8.
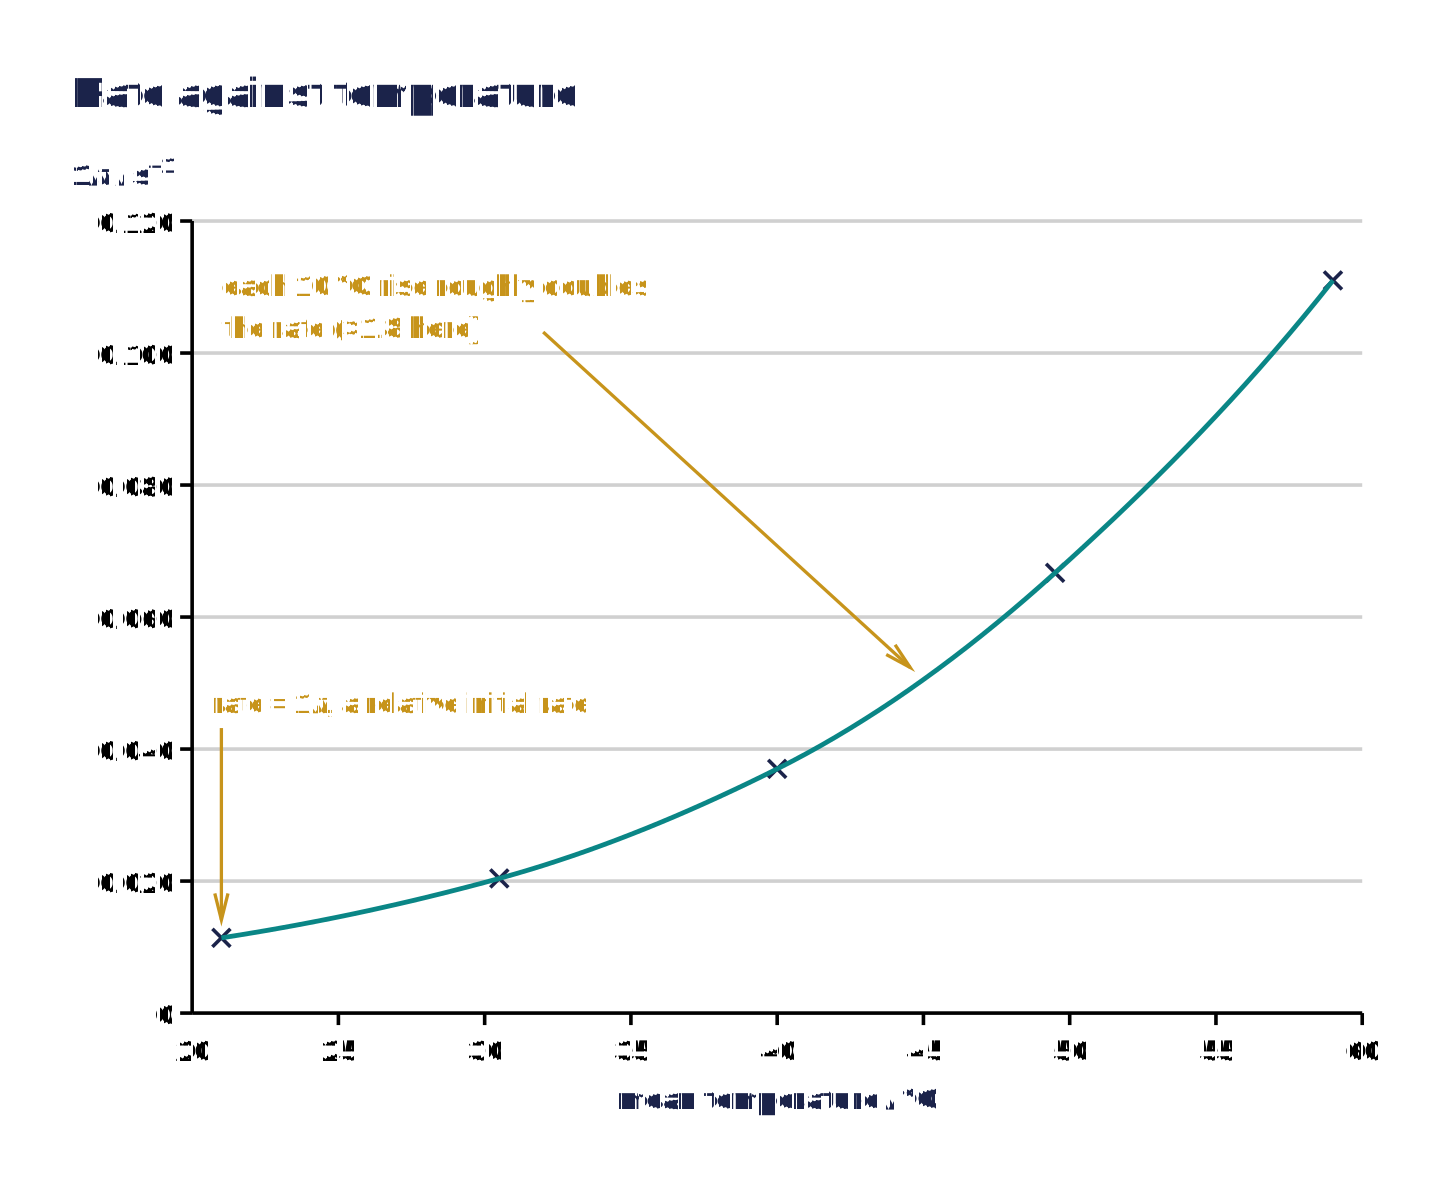
Rate (1/t) against mean temperature for the sample data: the curve becomes steeper as temperature rises, because each 10 °C rise multiplies the rate by about 1.8.
Conclusion: As the temperature increases, 1/t increases, so the rate increases; the increase is larger at higher temperatures, and a 10 °C rise roughly doubles the rate.
Explaining the Effect of Temperature
The explanation is marked in two parts. First, at a higher temperature the particles move faster, so they collide more often.
Second, and far more important, a much larger proportion of the collisions have energy equal to or greater than the activation energy, Eₐ, the minimum energy a collision needs to lead to reaction. The Maxwell–Boltzmann distribution shows why.
The curve shows how many particles have each energy. At the higher temperature the peak moves to higher energy and becomes lower, and the curve spreads out, but the area under it stays the same because the number of particles is unchanged.
The number of particles with energy of at least Eₐ is the area under the curve to the right of Eₐ. Because Eₐ lies in the tail of the curve, a small shift of the curve to higher energy makes that area much larger.
A 10 °C rise increases the collision frequency by only a few per cent, but it can roughly double the number of particles with enough energy to react.
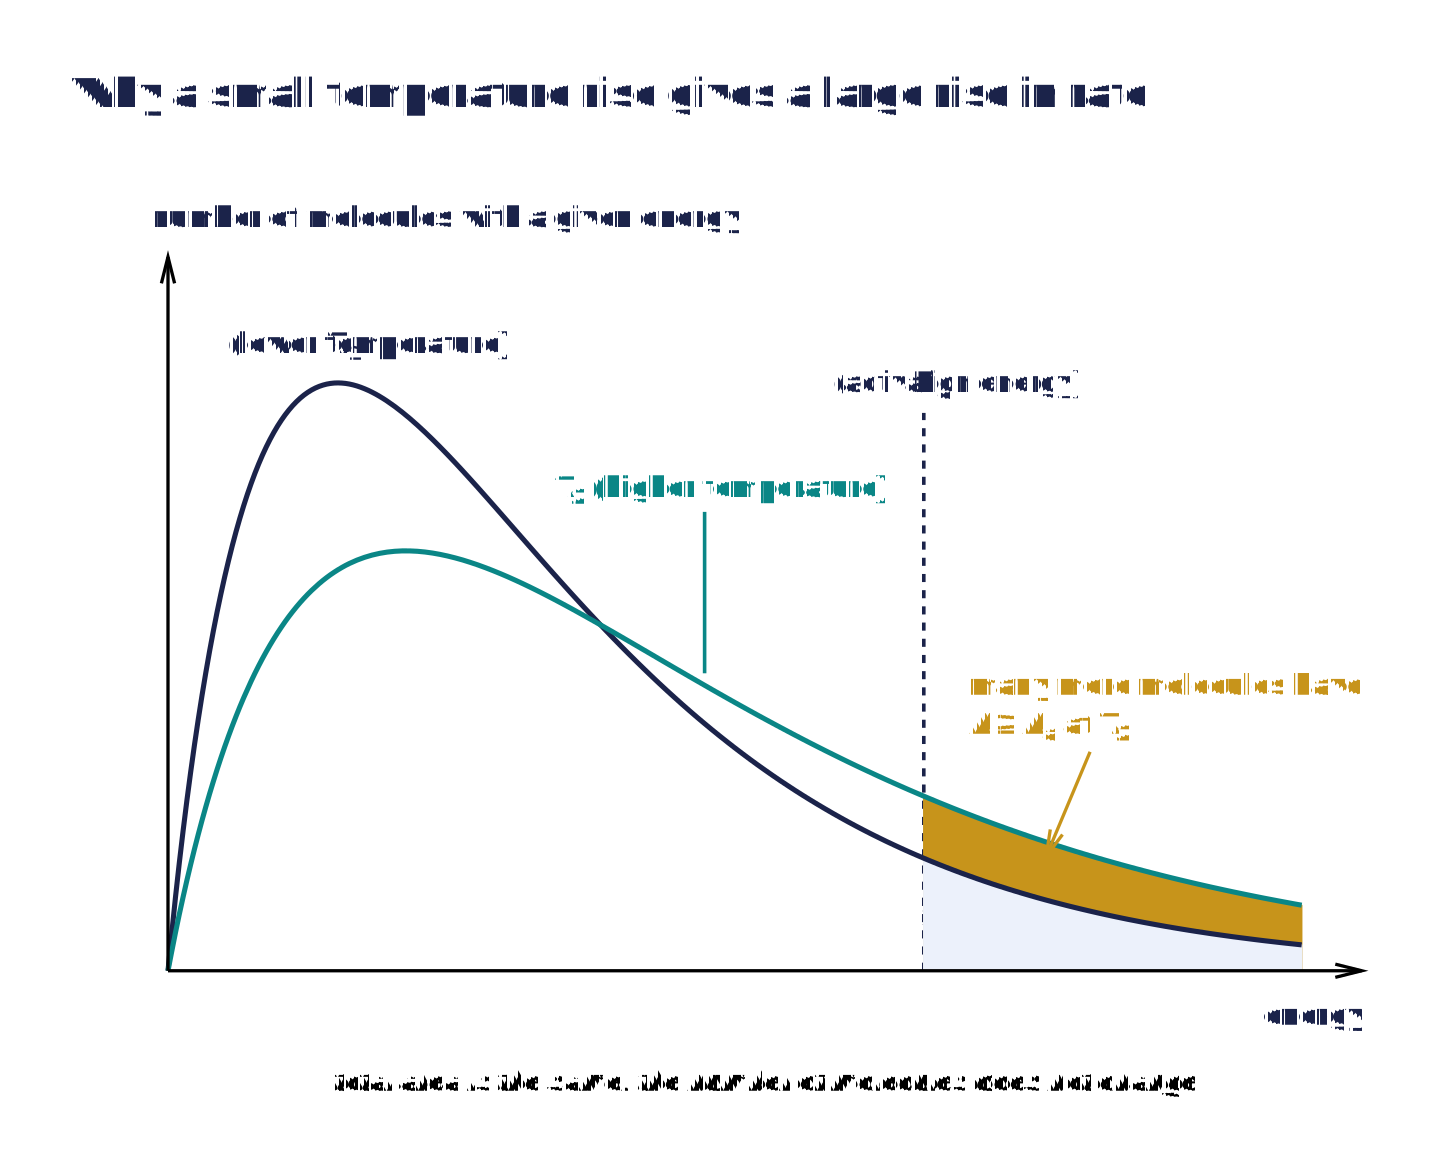
The energy distribution at two temperatures: at the higher temperature many more particles have energy at least equal to the activation energy, shown by the larger shaded area beyond Eₐ.
Exam answer model: “At a higher temperature the particles have more kinetic energy.
A greater proportion of particles have energy equal to or greater than the activation energy (the area beyond Eₐ on the Maxwell–Boltzmann distribution is larger), so a greater frequency of collisions are successful and the rate increases.”
Check: Energy Distributions and Temperature
Choose the correct statements about energy distributions, temperature and catalysts.
Variant: Changing the Concentration
The same reaction shows the effect of concentration. The temperature is kept constant and the thiosulfate is diluted with distilled water so that the total volume stays at 50 cm³ in every run.
A fixed total volume matters for two reasons: the concentration of thiosulfate is then proportional to the volume of thiosulfate solution used, and the depth of liquid over the cross is the same, so the same amount of sulfur still hides it.
The acid is added exactly as before, 5.0 cm³ of 2.0 mol dm⁻³, so its concentration is the same in every run.
| Volume of 0.10 mol dm⁻³ Na₂S₂O₃ / cm³ | Volume of water / cm³ | Concentration of Na₂S₂O₃ / mol dm⁻³ | Time t / s | 1/t / s⁻¹ |
|---|---|---|---|---|
| 50 | 0 | 0.100 | 88 | 0.0114 |
| 40 | 10 | 0.080 | 112 | 0.00893 |
| 30 | 20 | 0.060 | 145 | 0.00690 |
| 20 | 30 | 0.040 | 224 | 0.00446 |
| 10 | 40 | 0.020 | 430 | 0.00233 |
A graph of 1/t against concentration is a straight line through the origin, so the rate is directly proportional to the concentration of thiosulfate. Halving the concentration halves the rate and doubles the time.
The explanation is collision frequency: with twice as many thiosulfate ions in the same volume there are twice as many collisions with hydrogen ions per second, and the same fraction of them have enough energy.
The concentrations in the table are those of the thiosulfate solution before the acid is added. Adding the same 5.0 cm³ of acid to every run dilutes each one by the same factor, so the proportionality is unaffected.
![Graph of 1/t against Na₂S₂O₃ concentration: a straight line through the origin, so rate ∝ [S₂O₃²⁻]](https://www.onlinelearningsystem.net/xyz/wp-content/uploads/2026/09/skel-R3-rate-concgraph.svg)
Rate (1/t) against thiosulfate concentration at constant temperature: a straight line through the origin, so rate is proportional to concentration.
Remember: Dilute with water to a constant total volume. Using less thiosulfate without adding water changes the depth of liquid as well as the concentration, and the test is no longer fair.
Check: Controlling the Variables
Apply the constant-total-volume idea and the control of temperature to a different timed reaction.
Continuous Monitoring: Gas Volume and Loss of Mass
A timing experiment gives one number per run. Continuous monitoring follows a single reaction mixture as it happens, by measuring a physical quantity at regular intervals: the volume of gas given off, or the mass lost as gas escapes.
Calcium carbonate (marble chips) and hydrochloric acid give off carbon dioxide and can be followed either way.
CaCO₃(s) + 2HCl(aq) → CaCl₂(aq) + H₂O(l) + CO₂(g)
Gas volume: the flask is closed with a bung and a delivery tube leading to a gas syringe, and the volume is read every 10 s or 30 s.
The syringe holds 100 cm³, so the amounts are chosen to give less than that; the plunger must move freely.
Loss of mass: the flask stands on a balance reading to 0.01 g with a loose cotton wool plug in its neck, which lets the carbon dioxide out but stops droplets of acid spraying out, and the mass is recorded every 30 s.
The mass lost is the mass of carbon dioxide given off. This method suits carbon dioxide (Mr 44.0) but not hydrogen, whose mass is too small to measure on a 2 d.p. balance.
In the sample run, 10 g of marble chips (an excess) was added to 50 cm³ of 1.0 mol dm⁻³ hydrochloric acid. The acid is the limiting reagent: 0.050 mol of HCl gives 0.025 mol of CO₂, which is 0.025 × 44.0 = 1.10 g, the final mass lost.
| Time / s | 0 | 30 | 60 | 90 | 120 | 180 | 240 | 300 | 360 | 420 |
|---|---|---|---|---|---|---|---|---|---|---|
| Mass of CO₂ lost / g | 0.00 | 0.36 | 0.60 | 0.77 | 0.87 | 1.00 | 1.05 | 1.08 | 1.09 | 1.10 |

Two ways to follow calcium carbonate and hydrochloric acid as the reaction happens: the volume of carbon dioxide in a gas syringe, or the mass lost from a flask with a cotton wool plug on a balance.
The specification suggests using this reaction to see the effect of acid concentration. Repeat with 50 cm³ of 0.50, 1.5 and 2.0 mol dm⁻³ acid and the same mass of chips of the same size, and compare the initial gradients.
A higher concentration gives a steeper start, because acid particles collide with the chip surface more often. The final mass lost is larger too, because the acid is the limiting reagent.
Key idea: The curve is steepest at the start and levels off when the limiting reagent is used up. The gradient at any moment is the rate at that moment.
Rate From the Gradient of a Tangent
On a graph of a quantity against time, the rate at any moment is the gradient of the tangent to the curve at that time. The tangent is a straight line that touches the curve at that point only.
Draw it long, so that the triangle used for the gradient is as large as possible and the reading errors in the rise and the run are a small percentage.
Worked Example: the initial rate. The tangent at t = 0 starts at the origin and passes through (60 s, 0.87 g).
Step 1: rise = 0.87 − 0.00 = 0.87 g; run = 60 − 0 = 60 s
Step 2: initial rate = 0.87 g ÷ 60 s = 0.0145 g s⁻¹
Step 3: in moles of CO₂, 0.0145 g s⁻¹ ÷ 44.0 g mol⁻¹ = 3.30 × 10⁻⁴ mol s⁻¹
Worked Example: the rate at 120 s. The tangent that touches the curve at 120 s passes through (40 s, 0.63 g) and (200 s, 1.11 g).
Rise = 1.11 − 0.63 = 0.48 g; run = 200 − 40 = 160 s; rate = 0.48 ÷ 160 = 0.0030 g s⁻¹.
The rate has fallen to about a fifth of its initial value because the hydrochloric acid is being used up, so acid particles collide with the chips less often.
Answer: initial rate 0.0145 g s⁻¹ (3.30 × 10⁻⁴ mol s⁻¹ of CO₂); rate at 120 s 0.0030 g s⁻¹.
The units come from the axes: g s⁻¹ for a mass graph, cm³ s⁻¹ for a gas volume graph, mol dm⁻³ s⁻¹ for a concentration graph.
Common mistake: Students lose marks by joining two data points instead of drawing a tangent (that gives a mean rate over an interval), by using a tiny triangle, and by leaving out the unit.
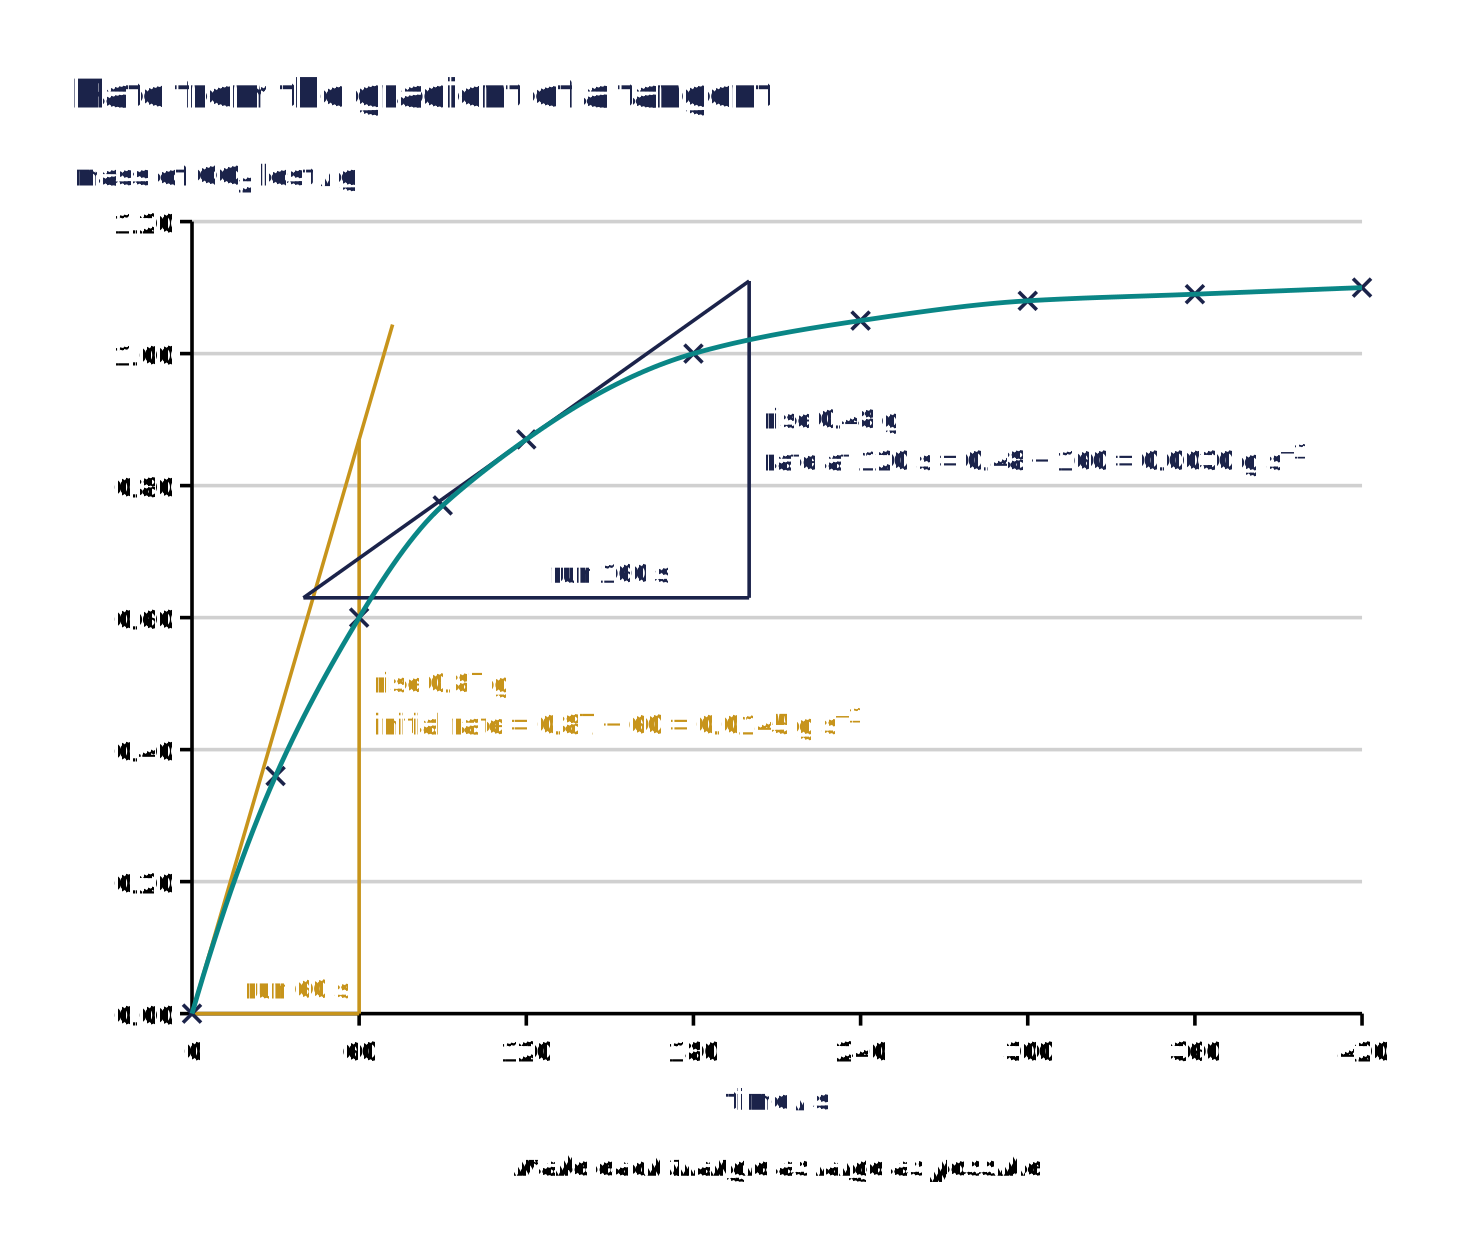
Mass of carbon dioxide lost against time for the sample run, with tangents at 0 s and at 120 s: the rate falls from 0.0145 g s⁻¹ to 0.0030 g s⁻¹ as the acid is used up.
Exam wording: “Draw a tangent to the curve at t = 0 and calculate its gradient: rate = change in mass ÷ change in time, in g s⁻¹.”
Check: Rates From a Gas Volume Graph
Use a tangent on a new gas volume graph and explain why the rate falls.
A Catalysed Reaction: Manganese(IV) Oxide and Hydrogen Peroxide
A gas syringe is the natural way to follow the decomposition of hydrogen peroxide, because oxygen hardly dissolves and its mass is too small for a balance.
The reaction is very slow on its own; a little solid manganese(IV) oxide, MnO₂, speeds it up enormously, and it is a heterogeneous catalyst because it is in a different phase from the reacting solution.
2H₂O₂(aq) → 2H₂O(l) + O₂(g)
In the sample run, 0.50 g of MnO₂ powder was added to 25 cm³ of 0.20 mol dm⁻³ hydrogen peroxide and the bung fitted at once. The peroxide is 0.0050 mol, which gives 0.0025 mol of oxygen, or 0.0025 × 24 000 = 60 cm³ at room temperature and pressure, well within a 100 cm³ syringe.
| Time / s | 0 | 10 | 20 | 30 | 40 | 60 | 80 | 100 | 120 | 180 |
|---|---|---|---|---|---|---|---|---|---|---|
| Volume of O₂ / cm³ | 0.0 | 15.5 | 27.0 | 35.5 | 42.0 | 50.0 | 54.5 | 57.0 | 58.5 | 60.0 |
The tangent at t = 0 passes through (20 s, 36 cm³), so the initial rate is 36 ÷ 20 = 1.8 cm³ s⁻¹. Without the catalyst, less than 1 cm³ of oxygen collects in the same two minutes.
After the reaction the MnO₂ can be filtered off, washed, dried and reweighed: its mass is still 0.50 g, which is the evidence that it is a catalyst and not a reactant.
The catalyst provides an alternative route with a lower activation energy, so on the Maxwell–Boltzmann distribution a much larger area lies beyond the new, lower Eₐ at the same temperature.
Remember: A catalyst does not change the energy distribution curve. It moves the activation energy line to the left, so more particles already have enough energy.
Errors, Uncertainty and Improvements
The main weakness of the disappearing cross is the end point. Deciding exactly when the cross “can no longer be seen” depends on the observer, the lighting and the angle.
It varies unpredictably from run to run, so it is a random error.
Exam focus: Writing “human error” earns no credit: say what is judged, and classify it.
Repeating each run and taking a mean reduces its effect; a light sensor or colorimeter removes it.
| Source of error | Type and effect | Improvement |
|---|---|---|
| Judging when the cross disappears | Random: times scatter either side of the true value, worst for short times | Use a light sensor and data logger that records when transmitted light falls to a set value; repeat and take a mean |
| Temperature falls during the run | The reaction happens below the start temperature; worst at 59 °C, where it fell 8.0 °C | Record start and end temperatures and use the mean; keep the flask in a thermostatic water bath with a clear side and a light sensor |
| Delay between adding the acid and starting the stopwatch | Random: times slightly too short or long | Add the acid in one smooth pour and start the clock with the other hand, or use a data logger |
| Measuring cylinder volumes | Random: small differences in the amounts, and so the concentrations, of each run | Use a burette or pipette for the thiosulfate, water and acid |
| A thermometer that reads 1 °C high | Systematic: every temperature is too high by the same amount | Check the thermometer in melting ice (0 °C); use the same thermometer throughout |
Percentage uncertainties. With the end point judged to ±1 s, the time at 21.0 °C (88 s) carries 1 ÷ 88 × 100 = 1.1%, but the time at 59.0 °C (9 s) carries 1 ÷ 9 × 100 = 11%.
The high-temperature results are the least precise, which is why a lower concentration is sometimes used at high temperatures to lengthen the time.
For the volumes, 50 cm³ in a 50 cm³ measuring cylinder (±0.5 cm³) is 0.5 ÷ 50 × 100 = 1.0%, and 5.0 cm³ in a 10 cm³ measuring cylinder (±0.1 cm³) is 0.1 ÷ 5.0 × 100 = 2.0%.
Each thermometer reading carries ±0.5 °C, which is small beside the 8.0 °C fall during the hottest run, so the cooling of the mixture, not the thermometer, is the larger temperature error.
For continuous monitoring, the largest error is gas lost before the bung is fitted (gas syringe) or acid spray escaping (balance, reduced by the cotton wool plug).
In the balance method the total change is only about 1 g, and each mass lost is the difference between two readings on a balance reading to 0.01 g, so it carries 2 × 0.005 = ±0.01 g.
That is 0.01 ÷ 0.36 × 100 = 2.8% of the first 30 s value.
Exam focus: Name the error, say which way it scatters or shifts the result, and give an improvement that removes it, not just “repeat the experiment”.
Check: Errors in Rate Experiments
Classify errors and work out percentage uncertainties for a different timed reaction.
Common Mistakes
The same errors appear in students’ write-ups and exam answers year after year. Each one costs a mark that the corrected version earns.
- Plotting time against temperature and calling it a rate graph. Rate is 1/t: the time falls as the rate rises.
- Warming the mixture after adding the acid. The acid is added to thiosulfate that is already at the chosen temperature, and the clock starts at that moment.
- Recording only the start temperature. The mixture cools, so record the end temperature too and use the mean.
- Changing the concentration without adding water. The total volume must be constant, or the depth of liquid over the cross changes too.
- Explaining temperature only by “more collisions”. The mark is for a greater proportion of collisions with energy at least equal to the activation energy.
- Drawing the energy curve so it touches the energy axis at high energy, or making the higher-temperature curve taller.
- Joining two data points and calling it a tangent, or leaving the unit off the gradient.
- Writing “human error”. Say what is judged inconsistently (the moment the cross disappears) and call it a random error.
Common Exam Points
Say
“The same amount of sulfur hides the cross each time, so rate is proportional to 1/t.”
“At a higher temperature a greater proportion of particles have energy equal to or greater than the activation energy, so a greater frequency of collisions is successful.”
“Rate is the gradient of the tangent to the curve at that time, in g s⁻¹.”
Do not say
“The cross disappears because the reaction finishes.” (It disappears long before the reaction finishes.) “Higher temperature lowers the activation energy.” (Only a catalyst provides a lower activation energy route.) “Human error.” “The graph of 1/t against temperature is a straight line.”
Watch for
Tables that ask for 1/t to a sensible number of significant figures; a graph where you must read a time for a temperature that was not measured.
Questions that switch to a gas syringe or a balance method and ask for the rate from a tangent; the choice of a fixed total volume; and the difference between an initial rate method and continuous monitoring.
FAQs
Short answers to the questions students most often ask about measuring rates of reaction.
Why do we use 1/t instead of the time?
Because rate is amount divided by time, and the amount of sulfur (or iodine, or gas) needed for the observation is the same every run.
With a fixed amount, rate is proportional to 1/t, so a shorter time means a faster rate. Plotting 1/t makes the graph show rate directly, which is what the question is about.
Why does the temperature have to be recorded at the start and the end?
The mixture loses heat to the room during the run, and it loses more the hotter it starts.
The mean of the start and end readings is a better estimate of the temperature of the reaction than the start value alone, and the size of the drop is itself an evaluation point.
Why is the graph of 1/t against temperature curved?
Because the rate does not rise by the same amount for each degree.
A small rise in temperature moves more of the Maxwell–Boltzmann distribution beyond the activation energy each time, so the rate is multiplied by roughly the same factor for each 10 °C.
A quantity that keeps being multiplied gives a curve that gets steeper.
Is the disappearing cross a continuous monitoring method?
No. It gives one time per run, the time for a fixed amount of product to form, so it is an initial rate method.
Continuous monitoring follows one mixture over time, for example with a gas syringe or a balance, and the rate is found from the gradient of a tangent.
What should I write about errors in the disappearing cross experiment?
The main one is judging exactly when the cross can no longer be seen. It varies from run to run, so it is a random error; reduce it by repeating and taking a mean, or remove it with a light sensor.
Also mention the temperature falling during the hot runs and the precision of the measuring cylinders.
Copyright and author footprint: This OLS revision page was written for Online Learning System by Dr. Mohammed Al-Fatah. It is designed for A Level Chemistry revision and should not be copied or redistributed without permission.
Keep this note — free
Save your progress across every AQA topic. A free account remembers which topics you have covered, saves your question scores, and syncs across your phone and laptop.
- Track every topic you have finished
- Keep your practice-question scores
- No payment, no card, free forever
Already registered? Log in