Rate–Concentration Graphs and the Initial-Rates Method
A concise revision guide to deducing orders from rate–concentration graphs and from initial-rates data: comparing experiments where one concentration changes, handling two changes at once, writing the rate equation and calculating the rate constant with its units.
- 5.1.1(b)(i)
- 5.1.1(b)(ii)
- 5.1.1(c)-i
- 5.1.1(c)-ii
- 5.1.1(g)(i)
What these spec points say
- 5.1.1(b)(i) deduction of orders from experimental data
- 5.1.1(b)(ii) deduction of a rate equation from orders of the form: rate = k[A]m[B]n, where m and n are 0, 1 or 2
- 5.1.1(c)-i calculation of the rate constant, k, and related quantities, from a rate equation
- 5.1.1(c)-ii determination of the units of the rate constant, k, from a rate equation
- 5.1.1(g)(i) from a rate–concentration graph: deduction of the order (0, 1 or 2) with respect to a reactant from the shape of the graph
Rate–Concentration Graphs
A rate–concentration graph plots the rate of reaction (usually the initial rate) against the concentration of one reactant. Its shape gives the order with respect to that reactant directly.
| Order | Shape of graph | Why |
|---|---|---|
| For a zero-order reactant | A horizontal line | The rate is the same at every concentration, and the height of the line is k. |
| For a first-order reactant | A straight line through the origin | Because rate = k[A] is the equation of a straight line with gradient k, so k can be read from the gradient. |
| For a second-order reactant | A curve that rises ever more steeply | Since rate = k[A]²; plotting the rate against [A]² instead gives a straight line through the origin, which confirms second order. |
The points on the graph come from a set of experiments in which only the concentration of that one reactant is changed.
Every other concentration, and the temperature, must be kept constant, otherwise the change in rate cannot be attributed to the reactant being studied.
Each rate is either a gradient at t = 0 from a concentration–time curve or a 1/t value from a clock reaction, as page 2 described.
Key idea: Rate against [A]: horizontal for zero order, straight through the origin for first order (gradient = k), curving upwards for second order (rate against [A]² is straight).
Check: Reading a Rate–Concentration Graph
Deduce the order, and where possible k, from rate–concentration graphs for reactions not drawn on this page.
Deducing Orders From Initial-Rates Data
Most initial-rates questions give a table rather than a graph. The method is to compare pairs of experiments in which only one concentration changes and see what the rate does.
Doubling a concentration and finding the rate unchanged means zero order; the rate doubling means first order; the rate quadrupling means second order.
The same logic works for any factor: if a concentration is trebled and the rate goes up nine times, the order is 2, because 3² = 9.
The table below is for the reaction A + B → products.
Step 1: Comparing experiments 1 and 2, [B] is unchanged while [A] doubles, and the rate doubles from 2.0 × 10⁻⁴ to 4.0 × 10⁻⁴ mol dm⁻³ s⁻¹, so the reaction is first order in A.
Step 2: Comparing experiments 1 and 3, [A] is unchanged while [B] doubles, and the rate rises four times, from 2.0 × 10⁻⁴ to 8.0 × 10⁻⁴ mol dm⁻³ s⁻¹, so the reaction is second order in B.
Answer: The rate equation is rate = k[A][B]², third order overall.
| Experiment | [A] / mol dm⁻³ | [B] / mol dm⁻³ | Initial rate / mol dm⁻³ s⁻¹ |
|---|---|---|---|
| 1 | 0.10 | 0.10 | 2.0 × 10⁻⁴ |
| 2 | 0.20 | 0.10 | 4.0 × 10⁻⁴ |
| 3 | 0.10 | 0.20 | 8.0 × 10⁻⁴ |
Write the comparison out every time, because the reasoning carries marks: “experiments 1 and 2: [A] × 2, [B] constant, rate × 2, so first order with respect to A”. A species whose concentration change leaves the rate unaltered is zero order and is left out of the rate equation, even though it is a reactant.
![Rate–concentration graphs for orders 0, 1 and 2 and a worked initial-rates table giving rate = k[A][B]²](https://www.onlinelearningsystem.net/xyz/wp-content/uploads/2026/09/kinetics-t11-04-initial-rates.jpg)
Rate–concentration graphs for the three orders beside the worked initial-rates table, with the run-by-run comparisons that give rate = k[A][B]².
Exam wording: For each order: name the two experiments, say which concentration changed and by what factor, say what the rate did, and state the order. Then write the rate equation.
When Two Concentrations Change at Once
Sometimes no pair of experiments differs in only one concentration. The rule is that the effects multiply.
Step 1: In one comparison [A] doubles and [B] doubles together, and the rate rises eight times.
Step 2: Having already found that the reaction is first order in A (which accounts for a factor of 2), the remaining factor is 8 ÷ 2 = 4, so the reaction must be second order in B.
In the same way, a run in which [A] is trebled and [B] doubled for a reaction with rate = k[A][B]² would show the rate rising 3 × 2² = 12 times.
The same multiplying rule predicts the rate of any new run once the rate equation is known.
Step 1: For rate = k[A][B]², a fourth experiment with [A] = 0.30 and [B] = 0.30 mol dm⁻³ has both concentrations three times those of experiment 1.
Step 2: So its rate is 3 × 3² = 27 times the rate of experiment 1.
Answer: 27 × 2.0 × 10⁻⁴ = 5.4 × 10⁻³ mol dm⁻³ s⁻¹.
Worked example: [A] doubles and [B] doubles; rate × 8. First order in A accounts for × 2; the remaining × 4 comes from B, so B is second order.
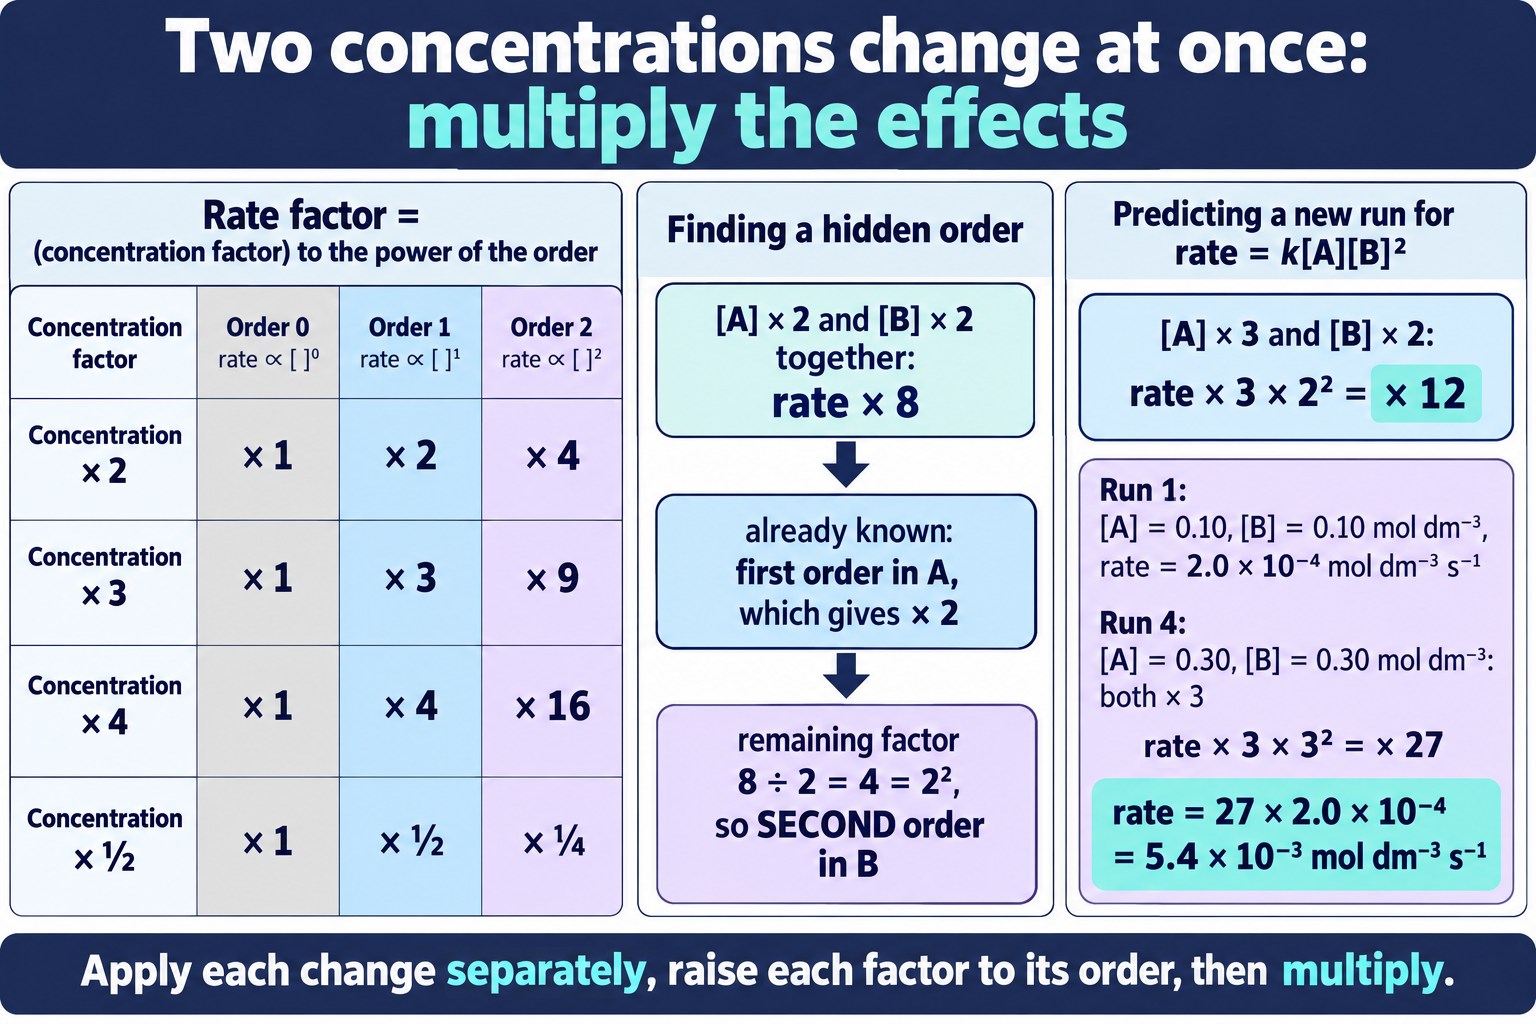
When two concentrations change together, raise each factor to its order and multiply, which both reveals a hidden order and predicts the rate of a new run.
Check: Orders From a Table
Deduce the orders and write the rate equation from initial-rates tables that are not the one on this page.
Calculating the Rate Constant
Once the rate equation is written, k is found by rearranging it and substituting the concentrations and rate from any one experiment.
Step 1: Using experiment 1 above: k = rate ÷ ([A][B]²) = 2.0 × 10⁻⁴ ÷ (0.10 × 0.10²) = 2.0 × 10⁻⁴ ÷ 1.0 × 10⁻³ = 0.20.
Step 2: The units come from the same rearrangement: mol dm⁻³ s⁻¹ ÷ (mol dm⁻³ × mol² dm⁻⁶) = mol⁻² dm⁶ s⁻¹.
Answer: k = 0.20 mol⁻² dm⁶ s⁻¹.
Because k is a constant at that temperature, substituting the values from experiment 2 or 3 must give the same answer. Checking a second run is a good way to catch an arithmetic slip.
Once k is known the rate equation can be used the other way round, to calculate the rate for any pair of concentrations or the concentration needed for a required rate.
If a question gives data at a different temperature, k will be different and must be recalculated. A larger k at a higher temperature is the quantitative version of “heating speeds the reaction up”.
Worked example: rate = k[A][B]²; from experiment 1, k = 2.0 × 10⁻⁴ ÷ (0.10 × 0.10²) = 0.20 mol⁻² dm⁶ s⁻¹. Check with experiment 3: 8.0 × 10⁻⁴ ÷ (0.10 × 0.20²) = 8.0 × 10⁻⁴ ÷ 4.0 × 10⁻³ = 0.20. The same value, as it must be.
Common Exam Points
Say
“Between experiments 1 and 2, [A] doubles and [B] is constant; the rate doubles, so the reaction is first order in A.” “k = rate ÷ [A][B]², with units mol⁻² dm⁶ s⁻¹.” “k is the same for every experiment at this temperature.”
Do not say
“The rate doubles so the order is 2.” “k = 0.20” without a unit. “A is not involved because it is zero order” (it reacts, but not in the rate-determining step).
Watch for
Tables where the rate is given in a different unit, or where the concentration is trebled or halved rather than doubled: apply the power, not the doubling rule.
Questions that give the rate equation and ask you to predict a rate: substitute and give the unit of rate, mol dm⁻³ s⁻¹.
Check: Calculating k
Calculate the rate constant with its units, and use it to predict a rate, for data that are not on this page.
FAQs
Use these quick answers to check the initial-rates method.
What does a rate–concentration graph look like for each order?
Zero order gives a horizontal line: rate does not change with concentration. First order gives a straight line through the origin, with gradient k. Second order gives a curve that gets steeper, and a plot of rate against [A]² is then a straight line.
How do I deduce an order from a table when two concentrations change at once?
Find the order of one substance first from a pair of experiments where only that concentration changes. Then allow for its effect in the other pair, and whatever change in rate is left over is due to the second substance.
What if tripling a concentration multiplies the rate by nine?
That is second order, because 3² = 9. Doubling would give ×4 and tripling gives ×9; the rate scales with the concentration squared.
Which experiment should I use to calculate k?
Any of them; k is the same for all runs at that temperature. Pick one with simple numbers, substitute rate and the concentrations into the rate equation and rearrange for k. Give the units every time.
Why do the experiments need the same temperature?
Because the whole method depends on k being identical in every run, so that any change in rate is due only to the concentration you changed. A warmer run would have a bigger k and would look like a higher order.
Copyright and author footprint: This OLS revision page was written for Online Learning System by Dr. Mohammed Al-Fatah. It is designed for A Level Chemistry revision and should not be copied or redistributed without permission.
Keep this note — free
Save your progress across every OCR A topic. A free account remembers which topics you have covered, saves your question scores, and syncs across your phone and laptop.
- Track every topic you have finished
- Keep your practice-question scores
- No payment, no card, free forever
Already registered? Log in