Titration Curves and Indicators
A concise revision guide to titration curves: the four shapes for strong and weak acids with strong and weak bases, the equivalence point and the vertical section, finding pKa at half-neutralisation, and choosing an indicator, plus diprotic acids and bases.
- 14.15-a
- 14.15-b
- 14.15-c
- 14.15-d
- 14.16-a
- 14.16-b
- 14.21i
- 14.21ii
What these spec points say
- 14.15-a be able to draw titration curves for all combinations of strong and weak monoprotic acids and bases
- 14.15-b be able to interpret titration curves for all combinations of strong and weak monoprotic acids and bases
- 14.15-c be able to apply titration curve principles to diprotic acids
- 14.15-d be able to apply titration curve principles to diprotic bases
- 14.16-a be able to select a suitable indicator for a titration using a titration curve
- 14.16-b be able to select a suitable indicator for a titration using appropriate data
- 14.21i understand how to use a weak acid-strong base or strong acid-weak base titration curve to: demonstrate buffer action
- 14.21ii understand how to use a weak acid-strong base or strong acid-weak base titration curve to: determine Ka from the pH at the point where half the acid is neutralised/ equivalence point
pH titration curves and indicators
Add 0.100 mol dm⁻³ base to 25.0 cm³ of 0.100 mol dm⁻³ acid and watch the pH curve draw itself, every point calculated.
© Dr. Mohammed Al-Fatah – onlinelearningsystem.net
Before You Start
This page uses ideas from pH and Strong Acids (strong acids, pH = −log[H⁺]) and Weak Acids: Ka and pKa (partial dissociation, Ka and pKa). Look back at either if the calculations feel unfamiliar.
GCSE Recap: Neutralisation and Titration
Three quick questions on the GCSE ideas this page builds on.
What a Titration Curve Shows
A titration curve is a graph of pH against the volume of acid or alkali added during a titration. It shows how the pH of the flask changes from start to finish.
How the data are collected
- Pipette 25.0 cm³ of the acid into a beaker and dip in a calibrated pH meter.
- Add the alkali from a burette, 1 cm³ at a time, swirling or stirring after each addition.
- Record the pH after each addition once the reading is steady.
- Add the alkali drop by drop close to the end point, where the pH changes fastest.
- Continue well past the end point, then plot pH (y-axis) against volume added (x-axis).
The equivalence point is the point at which the amount of alkali added has exactly reacted with the acid in the flask. For 25.0 cm³ of 0.100 mol dm⁻³ monoprotic acid and 0.100 mol dm⁻³ alkali it comes at 25.0 cm³.
Why there is a vertical section
pH is a logarithmic scale. Close to the equivalence point almost no acid is left, so one drop of alkali changes [H⁺] by a large factor.
- For hydrochloric acid and sodium hydroxide, the pH is 3.70 after 24.9 cm³ and 10.30 after 25.1 cm³.
- Those 0.2 cm³, about four drops, change the pH by 6.6 units.
- This almost vertical part of the curve is called the vertical section, and it is centred on the equivalence point.
Key idea: A titration curve plots pH against volume added. The equivalence point lies in the middle of the vertical section, where a tiny volume of alkali makes a very large change in pH.
Quick Check: A More Dilute Titration
Work out each pH for a much more dilute titration, then flip the card to check.
The Four Titration Curves
Each combination of a strong or weak acid with a strong or weak base gives its own shape. The examples below all use 25.0 cm³ of 0.100 mol dm⁻³ acid in the flask and 0.100 mol dm⁻³ base from the burette.
| Acid + base | Example | Starting pH | Vertical section | pH at equivalence | Final pH (50 cm³) |
|---|---|---|---|---|---|
| Strong + strong | HCl + NaOH | 1.00 | about 3 to 11 | 7.00 | about 12.5 |
| Weak + strong | CH₃COOH + NaOH | 2.88 | about 7 to 11 | about 8.7 | about 12.5 |
| Strong + weak | HCl + NH₃ | 1.00 | about 3 to 7 | about 5.3 | about 9.3 |
| Weak + weak | CH₃COOH + NH₃ | 2.88 | none | about 7 | about 9.3 |
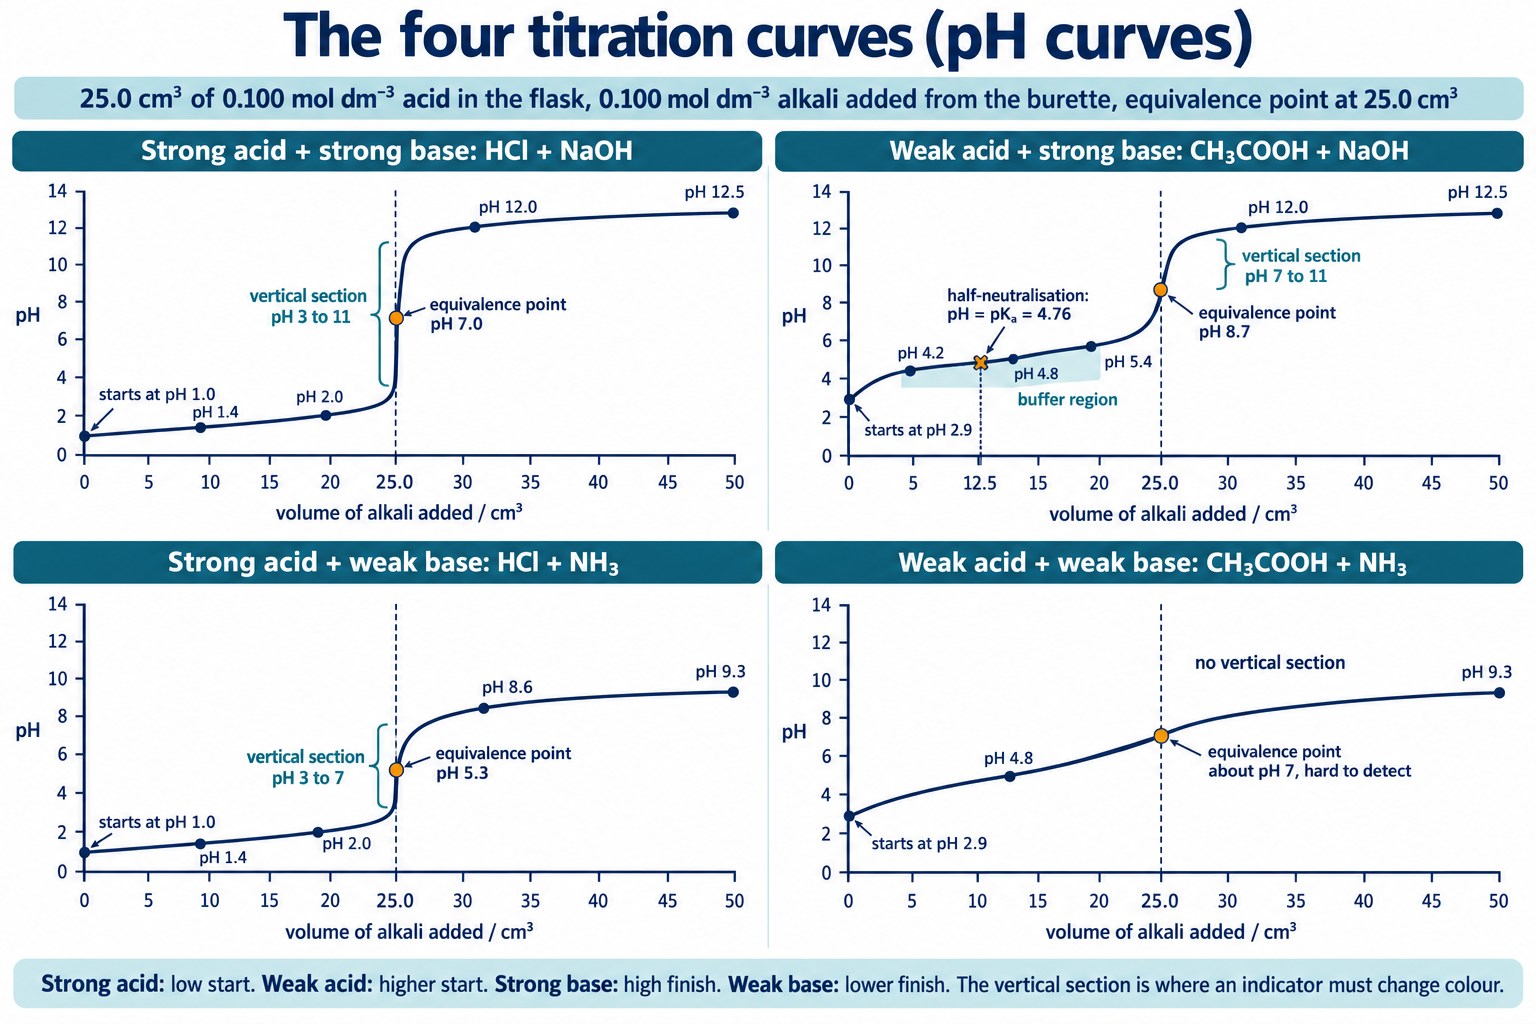
The four titration curves for 25.0 cm³ of 0.100 mol dm⁻³ acid with 0.100 mol dm⁻³ base: starting pH, vertical section and the pH at the equivalence point for each combination.
Reading the shapes
- Start: a strong acid starts low (pH 1.00) because it is fully dissociated. A weak acid starts higher (pH 2.88) because it is only partly dissociated.
- Finish: excess strong base (alkali) takes the pH to about 12.5. Excess weak base levels off lower, at about 9.3.
- Vertical section: it is long only when at least one of the two is strong. Weak acid with weak base gives a gradual change and no vertical section.
Why the equivalence point is not always pH 7
At the equivalence point the flask holds a solution of the salt. The ions of the salt decide its pH.
| Titration | Salt formed | Reaction of the salt with water | pH at equivalence |
|---|---|---|---|
| HCl + NaOH | NaCl | neither ion reacts with water | 7 |
| CH₃COOH + NaOH | CH₃COONa | CH₃COO⁻ + H₂O ⇌ CH₃COOH + OH⁻ | above 7 |
| HCl + NH₃ | NH₄Cl | NH₄⁺ ⇌ NH₃ + H⁺ | below 7 |
| CH₃COOH + NH₃ | CH₃COONH₄ | both ions react, effects roughly cancel | about 7 |
- If the alkali is in the flask and the acid is added from the burette, each curve is turned upside down: it starts high and falls.
- The equivalence volume depends only on the amounts reacting, not on whether the acid is strong or weak.
Sketching tip: Fix three points before drawing: the starting pH, the equivalence volume with its pH, and the final pH. Then join them with the right shape: flat, steep through equivalence, flat again.
Check: Reading the Four Titration Curves
Match titration curves to the acid and base used, and read the starting pH, the equivalence volume and the pH at equivalence, for titrations not used on this page.
Half-Neutralisation and the Buffer Region
The weak acid with strong base curve holds more information. Look at the gently sloping part before the vertical section.
- As NaOH is added, some CH₃COOH becomes CH₃COO⁻. The flask then holds a weak acid and its conjugate base together.
- That mixture is a buffer (see Buffer Solutions: How They Work and Why They Matter), so the pH rises only slowly. This part is the buffer region.
- The buffer region is flattest at the half-neutralisation point.
Why pH = pKa at half-neutralisation
At the half-neutralisation point exactly half of the acid has reacted. Half remains as CH₃COOH and half has become CH₃COO⁻, so the two concentrations are equal.
Ka = ([H⁺][CH₃COO⁻]) / ([CH₃COOH]) and [CH₃COO⁻] = [CH₃COOH]
so Ka = [H⁺] and pH = pKa
Worked example
25.0 cm³ of 0.100 mol dm⁻³ CH₃COOH is titrated with 0.100 mol dm⁻³ NaOH. Find Ka from the curve.
Answer. Ka = 10⁻ᵖᴷᵃ = 10⁻⁴·⁷⁶ = 1.74 × 10⁻⁵ mol dm⁻³
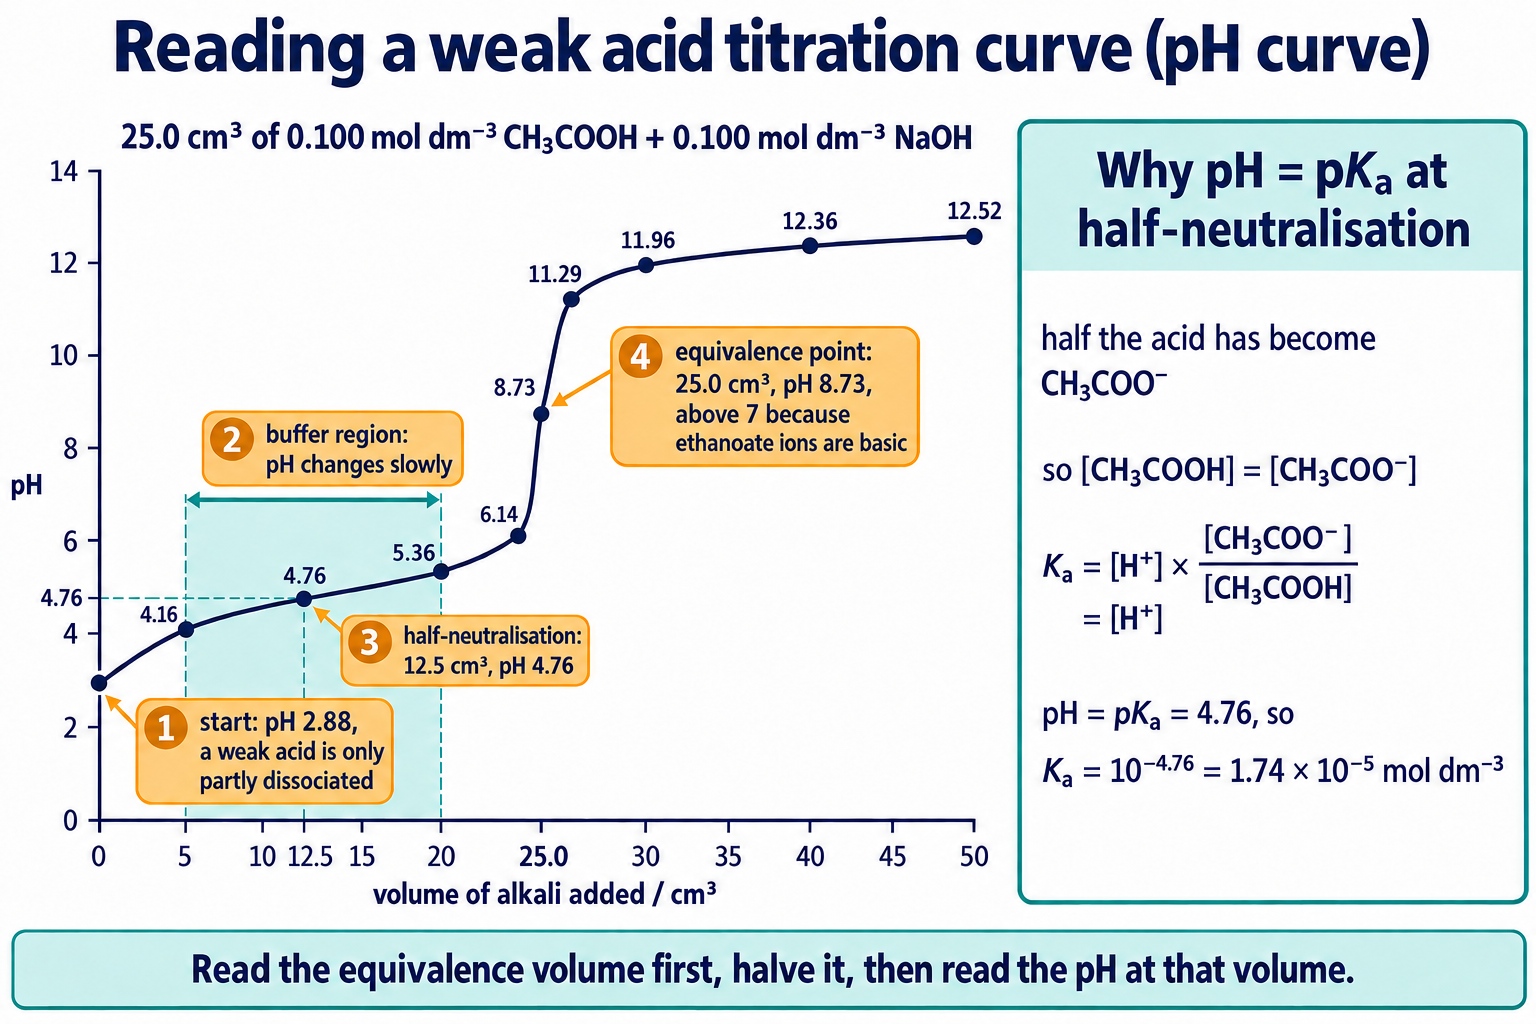
The weak acid with strong base titration curve: starting pH 2.88, the buffer region, half-neutralisation at 12.5 cm³ where pH = pKa = 4.76, and the equivalence point at 25.0 cm³ and pH 8.73.
Exam wording: “At half-neutralisation [HA] = [A⁻], so Ka = [H⁺] and pH = pKa.” Always find the equivalence volume first, then halve it.
Diprotic Acids and Bases
A diprotic acid can donate two protons, one at a time. Its titration curve with NaOH shows two steps and two equivalence points.
Ethanedioic acid with sodium hydroxide
HOOC–COOH + OH⁻ → HOOC–COO⁻ + H₂O
HOOC–COO⁻ + OH⁻ → ⁻OOC–COO⁻ + H₂O
- With 25.0 cm³ of 0.100 mol dm⁻³ acid and 0.100 mol dm⁻³ NaOH, the first equivalence point comes at 25.0 cm³ and the second at 50.0 cm³.
- The second step needs the same volume again, because the same number of protons is removed.
- Overall, 1 mol of ethanedioic acid reacts with 2 mol of NaOH. The first vertical section is often small.
Sodium carbonate with hydrochloric acid
The carbonate ion is a diprotic base: it accepts two protons, one at a time. The pH starts high and falls in two steps.
| Step | Reaction | Equivalence volume | pH at equivalence | Indicator |
|---|---|---|---|---|
| First | CO₃²⁻ + H⁺ → HCO₃⁻ | 25.0 cm³ | about 8.3 | phenolphthalein |
| Second | HCO₃⁻ + H⁺ → H₂O + CO₂ | 50.0 cm³ | about 4 | methyl orange |
These volumes are for 25.0 cm³ of 0.100 mol dm⁻³ Na₂CO₃ with 0.100 mol dm⁻³ HCl.
Key idea: A diprotic acid or base reacts in two stages, so its curve has two vertical sections. The second equivalence volume is twice the first.
Check: Half-Neutralisation and pKa
Use the half-neutralisation point of a titration curve to find pKa and Ka, and explain the buffer region, for weak acids and volumes not used on this page.
Indicators and How to Choose One
An acid-base indicator is itself a weak acid, HIn, whose undissociated form and conjugate base have different colours.
HIn(aq) ⇌ H⁺(aq) + In⁻(aq)
- Adding acid raises [H⁺], so the equilibrium shifts to the left and the colour of HIn shows.
- Adding alkali removes H⁺, so the equilibrium shifts to the right and the colour of In⁻ shows.
- The end point is where [HIn] = [In⁻]. There pH = pKin, and the colour change is seen over about pKin ± 1.
| Indicator | pH range | Colour of HIn (acid) | Colour of In⁻ (alkali) |
|---|---|---|---|
| Methyl orange | 3.1 to 4.4 | red | yellow |
| Bromothymol blue | 6.0 to 7.6 | yellow | blue |
| Phenolphthalein | 8.3 to 10.0 | colourless | pink |
The rule for choosing
Choose an indicator whose whole colour-change range lies inside the vertical section of the titration curve. Its end point then coincides with the equivalence point.
| Titration | Vertical section | Suitable indicator |
|---|---|---|
| Strong acid + strong base | about pH 3 to 11 | methyl orange or phenolphthalein |
| Weak acid + strong base | about pH 7 to 11 | phenolphthalein |
| Strong acid + weak base | about pH 3 to 7 | methyl orange |
| Weak acid + weak base | none | no indicator is suitable; use a pH meter |
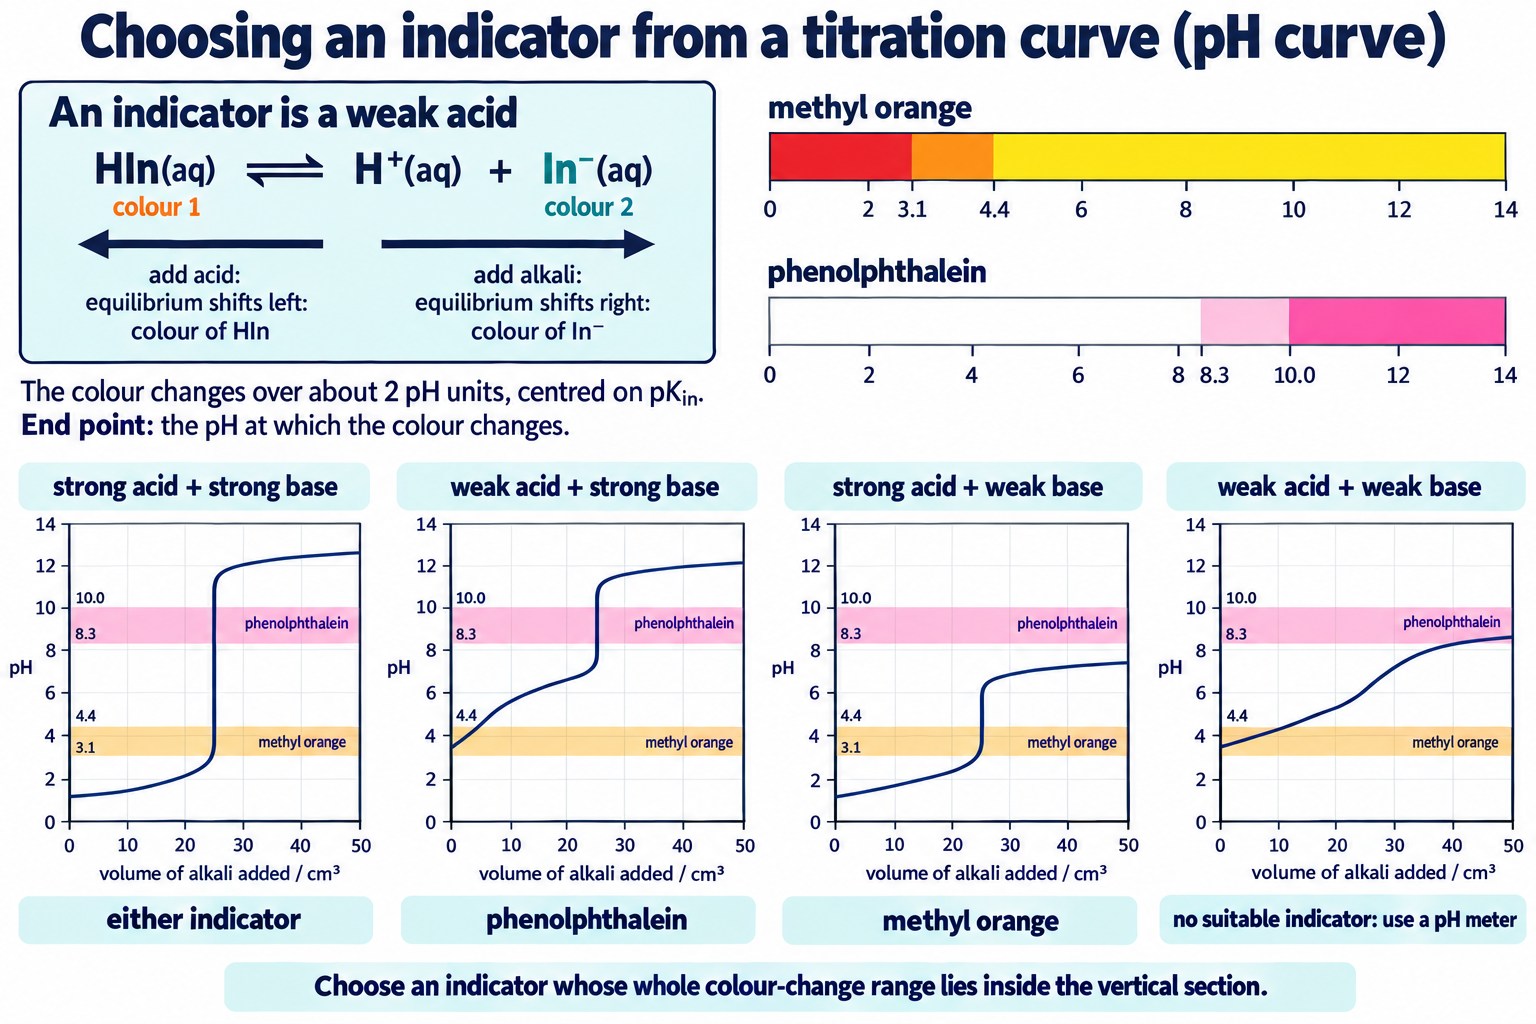
Choosing an indicator: methyl orange (3.1 to 4.4) and phenolphthalein (8.3 to 10.0) drawn as bands across the four titration curves. An indicator is suitable only where the curve passes vertically through its band.
- Use only two or three drops: the indicator is a weak acid and reacts with a little of the alkali.
- Methyl orange in a weak acid with strong base titration would change colour gradually, well before the equivalence point.
Exam wording: “Phenolphthalein, because its pH range (8.3 to 10.0) lies within the vertical section of the curve.” Quote the range and the vertical section, not just the name.
Common Exam Points
Say
- “The equivalence point is where the amounts of acid and base have exactly reacted.”
- “At half-neutralisation [HA] = [A⁻], so pH = pKa.”
- “The indicator’s pH range lies within the vertical section of the curve.”
Do not say
- “The equivalence point is always at pH 7” (only for strong acid with strong base).
- “Any indicator will do for a weak acid with a weak base” (none is suitable).
- “The end point and the equivalence point are the same thing” (they coincide only with a well-chosen indicator).
Watch for
- Sketches: mark the starting pH, the equivalence volume and the final pH clearly on the axes.
- Weak acid curves: a rapid rise at the start, then the flatter buffer region.
- Different concentrations of acid and alkali: work out the equivalence volume from moles first.
Check: Choosing an Indicator
Choose a suitable indicator from given pH ranges and explain the colour change using the HIn equilibrium, for titrations and indicators not used on this page.
FAQs
Use these quick answers to check titration curves and the choice of indicator.
What is the difference between the equivalence point and the end point?
The equivalence point is where the acid and base have exactly reacted in the ratio of the equation. The end point is where the indicator changes colour. With a well-chosen indicator the two coincide, inside the vertical section.
Why is the pH at equivalence not always 7?
At equivalence the flask holds a salt solution. Ethanoate ions accept protons from water, so CH₃COONa gives a pH above 7. Ammonium ions donate protons, so NH₄Cl gives a pH below 7. Only a strong acid with a strong base gives pH 7.
How do I find pKa from a titration curve?
Read the equivalence volume from the middle of the vertical section and halve it. At that half-neutralisation volume [HA] = [A⁻], so Ka = [H⁺] and the pH read from the titration curve equals pKa.
How do I choose an indicator?
Choose one whose whole colour-change range lies within the vertical section of the titration curve. Phenolphthalein, 8.3 to 10.0, suits a weak acid with a strong base. Methyl orange, 3.1 to 4.4, suits a strong acid with a weak base.
Why does a diprotic acid give two vertical sections?
It donates its two protons one at a time, so it is neutralised in two stages, each with its own equivalence point. The second equivalence volume is twice the first, because the same number of protons is removed again.
Copyright notice: This OLS revision content, including the explanations, layout, diagrams, tables and embedded learning structure, is authored for Online Learning System by Dr. Mohammed Al-Fatah. It may not be copied, reproduced, redistributed or adapted without written permission.
Keep this note — free
Save your progress across every Edexcel IAL topic. A free account remembers which topics you have covered, saves your question scores, and syncs across your phone and laptop.
- Track every topic you have finished
- Keep your practice-question scores
- No payment, no card, free forever
Already registered? Log in