Identifying Compounds from Mass Spectra
A concise revision guide to using the molecular ion peak and peak pattern in a mass spectrum to help identify an unknown compound.
GCSE Recap: Relative Formula Mass
Before you start, check that you can still calculate a relative formula mass from a formula.
What Does Identifying a Compound Mean?
Mass spectrometry can be used to help identify unknown compounds by analysing the pattern of peaks in their spectra.
The most important starting point is often the molecular ion peak, also called the M+ peak. This peak is caused by the molecular ion formed when one electron is removed from the molecule.
Molecular ion: the positive ion formed when a molecule loses one electron, usually written as M+.
Key idea: for a 1+ ion, the m/z value of the molecular ion peak is equal to the relative molecular mass of the compound.
Use the Molecular Ion Peak to Find Molecular Mass
In electron impact ionisation, high-energy electrons remove an electron from some molecules, forming molecular ions.
M(g) + e– → M+(g) + 2e–
The molecular ion normally has a single positive charge, so its m/z value matches the relative molecular mass.In a mass spectrum, the molecular ion peak is usually the peak with the highest significant m/z value. Small M+1 peaks may appear just above it because of naturally occurring isotopes such as carbon-13, so these are usually ignored when finding the main molecular mass.
Exam focus: use the highest significant molecular ion peak, not a small M+1 isotope peak, when identifying the molecular mass.
Quick Check: Choosing the Molecular Ion Peak
Decide which peak gives the molecular mass of a new hydrocarbon and explain the small peak above it.
Read the Axes Before Interpreting the Spectrum
The x-axis in a mass spectrum shows the mass-to-charge ratio, written as m/z. The y-axis shows the relative abundance of ions, often expressed as a percentage. The tallest peak is called the base peak. It comes from the most abundant ion and is given a relative abundance of 100%.
For most introductory A Level examples, the ions are assumed to have a 1+ charge. This means the m/z value can be interpreted directly as the mass of that ion.
| Feature | Meaning | How it helps identify a compound |
|---|---|---|
| m/z value | Mass-to-charge ratio of an ion | For 1+ ions, it gives the mass of the ion. |
| Relative abundance | How common each ion is compared with the others | The peak pattern can support a suggested structure. |
| M+ peak | Peak caused by the molecular ion | Its m/z value gives the relative molecular mass. |
| Base peak | The tallest peak, set at 100% relative abundance | It is often a fragment ion, so do not assume it is the M+ peak. |
Quick Check: Reading the Axes
Read the listed peaks of a new spectrum and type a number in each gap.
Worked Example: Identifying Ethanol
The mass spectrum of an unknown alcohol shows a molecular ion peak at m/z 46. Assuming the molecular ion has a 1+ charge, this means the relative molecular mass of the compound is 46.
Step 1: Find the molecular ion peak
The molecular ion peak is at m/z 46, so the compound has Mr = 46.
Step 2: Compare with possible alcohols
Ethanol has formula C2H5OH, or C2H6O.
Step 3: Calculate the relative molecular mass
(2 × 12.0) + (6 × 1.0) + 16.0 = 46.0
Mr of ethanol = 46.0
This matches the molecular ion peak at m/z 46.Quick Check: Match the Peak to a Formula
Calculate the relative molecular mass of each candidate on paper before you flip the card.
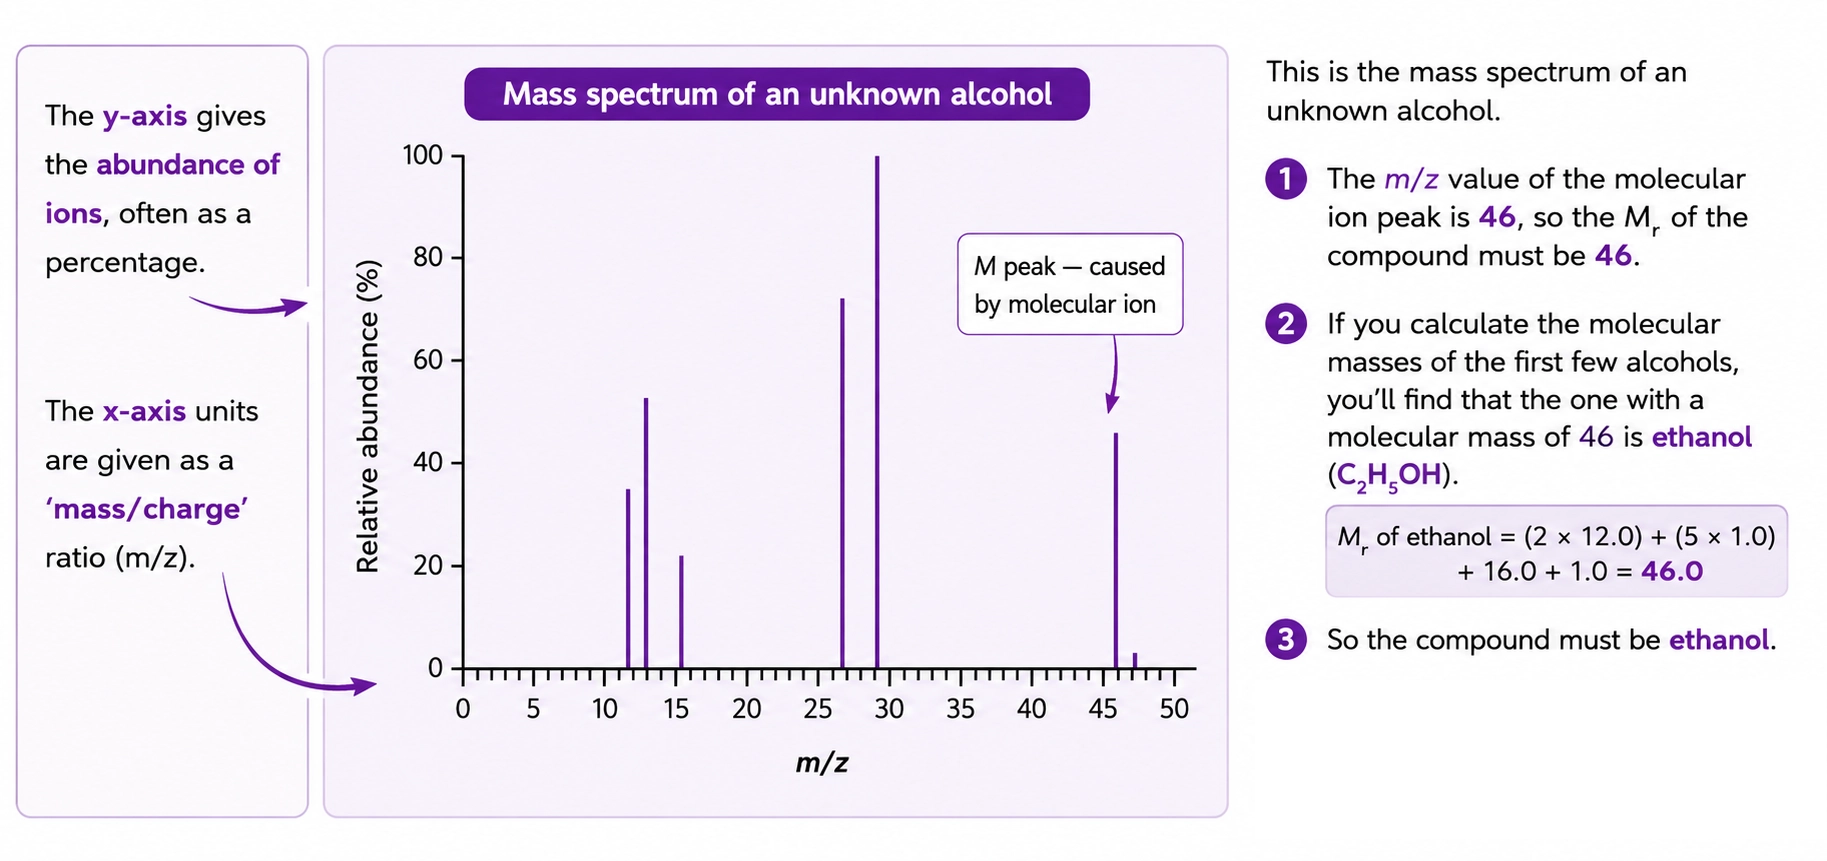
The molecular ion peak at m/z 46 matches the relative molecular mass of ethanol, C2H5OH.
Use the Peak Pattern to Support the Identity
The molecular ion peak gives the molecular mass, but a mass spectrum usually contains other peaks as well. These arise from fragment ions, produced when the molecular ion breaks apart.
Fragment peaks can help distinguish compounds with the same molecular mass. For example, different alcohols may produce different fragment ion patterns even if they have the same molecular formula.
Key idea: molecular ion peak first, then peak pattern. The molecular ion peak gives molecular mass, while fragment peaks help support the identity or structure.
Quick Check: Tallest Peak or Molecular Ion Peak?
Decide what a new spectrum tells you when the tallest peak is not the one with the highest m/z value.
Quick Check: How Far Does the Evidence Go?
In each round, pick the one statement that is accurate.
Common Exam Points
These points help avoid common mistakes when interpreting mass spectra of unknown compounds.
Do not confuse the base peak with the molecular ion peak
The base peak is the tallest peak. The molecular ion peak is the peak caused by the whole molecule after losing one electron. They are not always the same peak.
Use the highest significant m/z value
The molecular ion peak is usually at the highest significant m/z value. Small M+1 peaks can occur due to carbon-13 and should not normally be used as the main molecular mass.
State the charge assumption
For a 1+ molecular ion, m/z is equal to the molecular mass. If the charge were different, the relationship would change.
Show the molecular mass calculation
When suggesting a compound, calculate its Mr and compare it directly with the molecular ion peak.
QuickSnap Summary
Identifying a compound from a mass spectrum starts with the molecular ion peak, then uses the wider peak pattern to support the proposed identity.
Find the molecular ion, M+, peak in the spectrum.
For a 1+ ion, use the m/z value of the molecular ion peak as the molecular mass.
Compare the molecular mass with possible compounds by calculating their Mr values.
Use fragment peaks and the overall peak pattern as supporting evidence for the proposed compound.
Master Atomic Structure and the Periodic Table for AQA A Level Chemistry
Continue from these free revision notes into the full 3.1.1 and 3.2.1 Atomic Structure and the Periodic Table course. The five guided video lessons are ready now; the AQA MCQ bank, teacher-marked short-answer questions, supplementary lessons and KASP spec-point mapping are being completed.
Guided video teaching
Learn the chemistry and exam technique through structured video lessons with worked examples and walkthroughs.
Instant MCQ feedback
Auto-marked MCQ quizzes provide immediate diagnostic feedback for every answer choice.
Teacher-marked SAQs
Submit written exam responses and receive chemistry specialist feedback with improvement guidance.
Progress tracking
Identify strengths and weaknesses across the full 3.1.1 and 3.2.1 specification with targeted reporting.
See how the course works
Click play to start the course preview animation.
Some ionic radii are shown.
| Ion | Ionic radius / nm |
|---|---|
| Na+ | 0.102 |
| K+ | 0.138 |
| F− | 0.133 |
| Cl− | 0.180 |
Which compound has the strongest ionic bonding?
Explain why the metallic bonding in magnesium is much stronger than that in sodium.
FAQs
These questions focus on the main exam points for identifying compounds from mass spectra.
What is the molecular ion peak?
The molecular ion peak is the peak caused by the whole molecule after it has lost one electron. It is often written as the M+ peak.
How does the molecular ion peak identify molecular mass?
If the molecular ion has a 1+ charge, the m/z value of the molecular ion peak is equal to the relative molecular mass of the compound.
Why might there be a small peak after the M+ peak?
A small M+1 peak can occur because of naturally occurring heavier isotopes, such as carbon-13. This should not normally be used as the main molecular ion peak.
Why is ethanol identified from a molecular ion peak at m/z 46?
Ethanol has formula C2H5OH. Its relative molecular mass is (2 × 12.0) + (6 × 1.0) + 16.0 = 46.0, matching the molecular ion peak at m/z 46.
Are fragment peaks useful for identification?
Yes. Fragment peaks help support the proposed structure because different compounds can break into different characteristic ions.
Copyright notice: This OLS revision content, including the explanations, layout, diagrams, tables and embedded learning structure, is authored for Online Learning System by Dr. Mohammed Al-Fatah. It may not be copied, reproduced, redistributed or adapted without written permission.
Keep this note — free
Save your progress across every AQA topic. A free account remembers which topics you have covered, saves your question scores, and syncs across your phone and laptop.
- Track every topic you have finished
- Keep your practice-question scores
- No payment, no card, free forever
Already registered? Log in