Techniques for Measuring Rates
A concise revision guide to choosing and justifying a technique for rate data: gas volume, mass change, colorimetry, sampling with quenching and titration, and other methods, and the two ways of using them, continuous monitoring and the initial-rates method, including clock reactions.
- 3.1.9.2iii
What these spec points say
- 3.1.9.2iii use initial concentration-time data to deduce the initial rate of a reaction
Choosing a Technique
Every rate experiment follows a property of the mixture that changes as the reaction happens, and the property decides the technique.
| What changes | Technique |
|---|---|
| If a gas is given off | Its volume can be collected in a gas syringe, or the loss in mass of the open flask followed on a balance. |
| If a reactant or product is coloured | A colorimeter measures how the absorbance changes. |
| If nothing visible changes | Samples can be taken at intervals, the reaction in each sample stopped, and the concentration of one species found by titration. |
| If the number or type of ions changes | The conductivity of the solution changes. |
| If an acid is made or used | The pH does. |
| Technique | What is measured | Suitable for |
|---|---|---|
| Gas volume | Volume of gas in a gas syringe or an inverted burette at known times | Reactions that produce a gas, for example Mg(s) + 2HCl(aq) → MgCl₂(aq) + H₂(g) |
| Mass change | Mass of the flask and contents on a balance, with cotton wool in the neck so the gas escapes but nothing spits out | Reactions that lose a dense gas, for example CaCO₃(s) + 2HCl(aq) → CaCl₂(aq) + H₂O(l) + CO₂(g) |
| Colorimetry | Absorbance of the mixture in a cuvette at a wavelength the coloured species absorbs; a calibration curve converts absorbance to concentration | Reactions where one species is coloured, for example the brown iodine fading in the iodine–propanone reaction |
| Sampling, quenching and titration | The concentration of one species in a sample whose reaction has been stopped | Reactions of acids, alkalis, iodine or other species that can be titrated, when no gas or colour change is available |
| Conductivity | Electrical conductivity of the solution | Reactions that make or remove ions, for example the hydrolysis of 2-chloro-2-methylpropane, which produces H⁺ and Cl⁻ |
| pH | pH with a probe and meter | Reactions that produce or consume H⁺, for example the hydrolysis of an ester by water |
A question that asks you to select and justify a technique wants both halves: name the technique, then link it to the property that changes.
“Use a colorimeter, because iodine is the only coloured species and its absorbance falls as it is used up” is a full answer; “use a colorimeter” alone is not.
The technique must also not disturb the mixture: a titration takes minutes, so a sample must be quenched first.
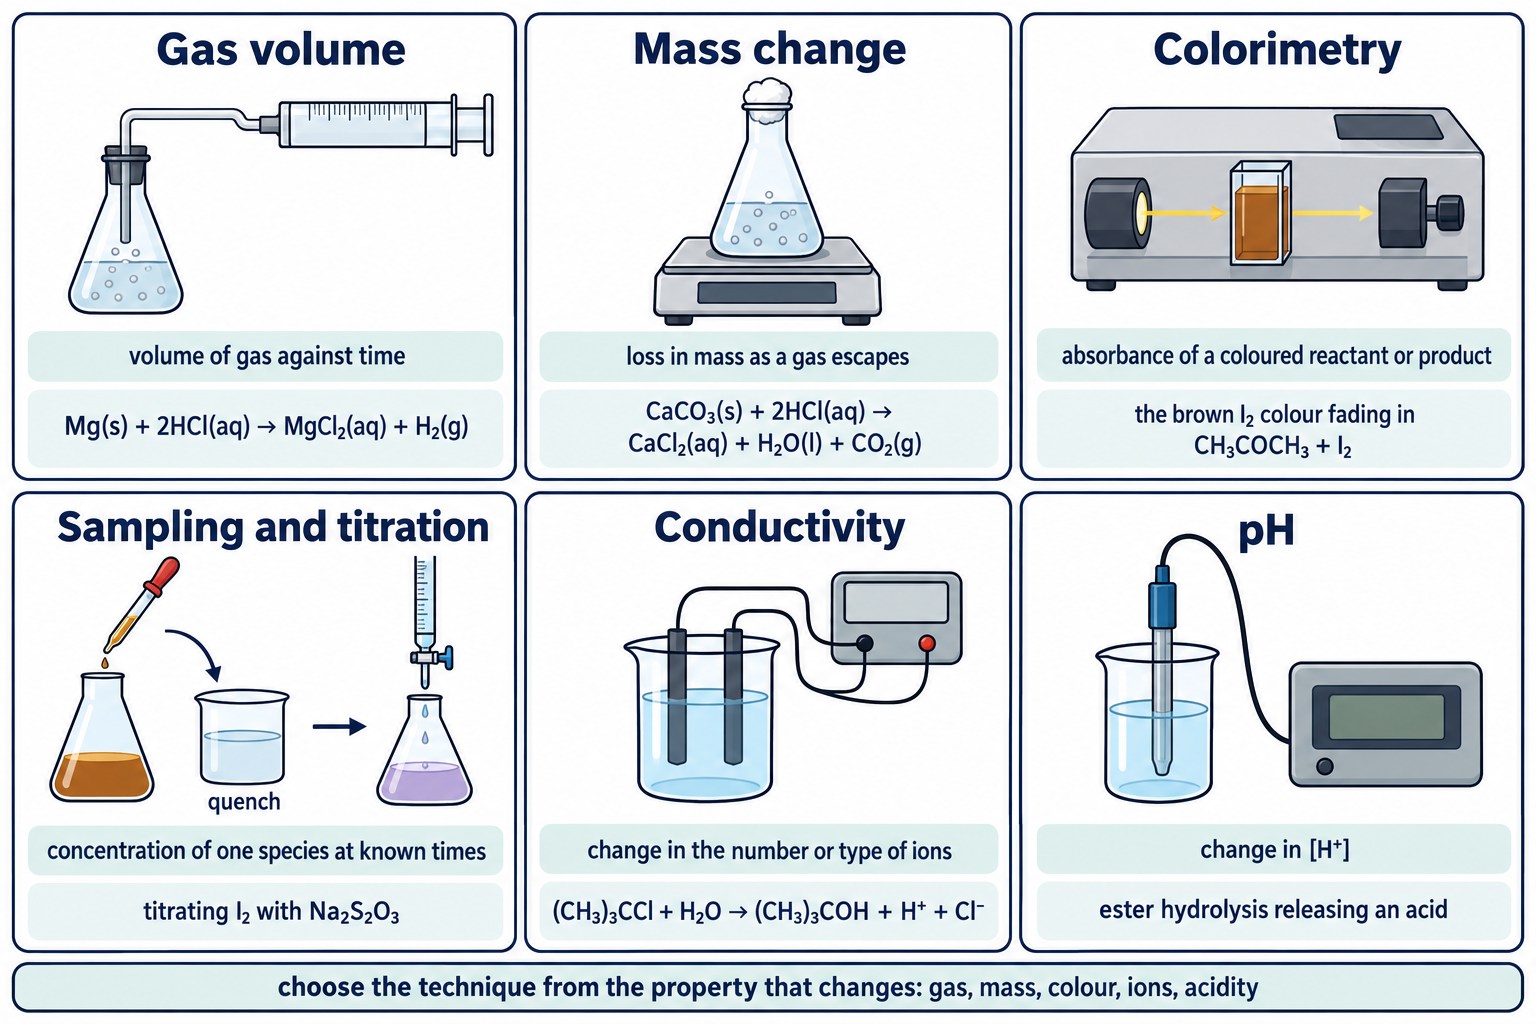
Six ways of following a reaction, each with the apparatus, the quantity measured and an example reaction.
Key idea: Match the technique to the property that changes: gas evolved, mass lost, colour, ions, acidity, or a species that can be titrated after quenching.
Check: Which Technique?
Match a technique to a reaction and justify the choice for reactions not listed on this page.
Continuous Monitoring
In continuous monitoring one reaction mixture is followed from start to finish, with readings taken at regular intervals.
The results are plotted as a concentration–time graph (or a volume–time or mass–time graph, which can be converted to concentrations).
The gradient of the curve at any time is the rate at that time, so one experiment gives the rate at many different concentrations. Page 3 shows how the shape and half-lives give the order.
The method only gives a clean order if the concentration of one reactant is changing significantly. The other reactants are therefore used in a large excess, so that their concentrations are effectively constant throughout and they behave as pseudo-zero order.
Exam wording: “Continuous monitoring follows one reaction mixture over time to give a concentration–time graph; the other reactants are in large excess so that only one concentration changes.”
The Initial-Rates Method
In the initial-rates method several separate experiments are run. In each one the initial concentration of one reagent is changed while every other concentration, the temperature and the volume are kept the same, and the initial rate is measured.
The initial rate is the gradient of the tangent to the concentration–time curve at t = 0, and it is used because it is the only moment when all the concentrations are known exactly: they are the ones that were mixed.
Comparing the initial rates gives the order with respect to the reagent that was varied (page 4).
Drawing tangents for every run is slow, so a clock reaction is an acceptable approximation. A fixed, small amount of a product is allowed to form, and the time, t, for a sudden visible change to signal it is recorded.
Because the same amount of product forms each time, the average rate over that interval is proportional to 1 ÷ t, and 1/t is used as the initial rate.
In the iodine clock, hydrogen peroxide oxidises iodide ions to iodine. A known small amount of thiosulfate ions removes the iodine as fast as it forms, and when the thiosulfate is used up the free iodine turns starch blue-black.
In the thiosulfate and acid reaction the time for the sulfur precipitate to hide a cross under the flask is used in the same way.
The clock method is an approximation because it measures an average rate over the first part of the reaction, not the true gradient at t = 0.
It is accurate provided that only a small fraction of the reactants has been used up when the clock stops, so that the concentrations are still close to their initial values.
Required practical 7 covers both the initial-rates method and continuous monitoring.
Worked example: A clock reaction takes 60 s with [I⁻] = 0.010 mol dm⁻³ and 30 s with [I⁻] = 0.020 mol dm⁻³, other concentrations unchanged. Rate ∝ 1/t, so the rate has doubled when [I⁻] doubled: first order with respect to I⁻.
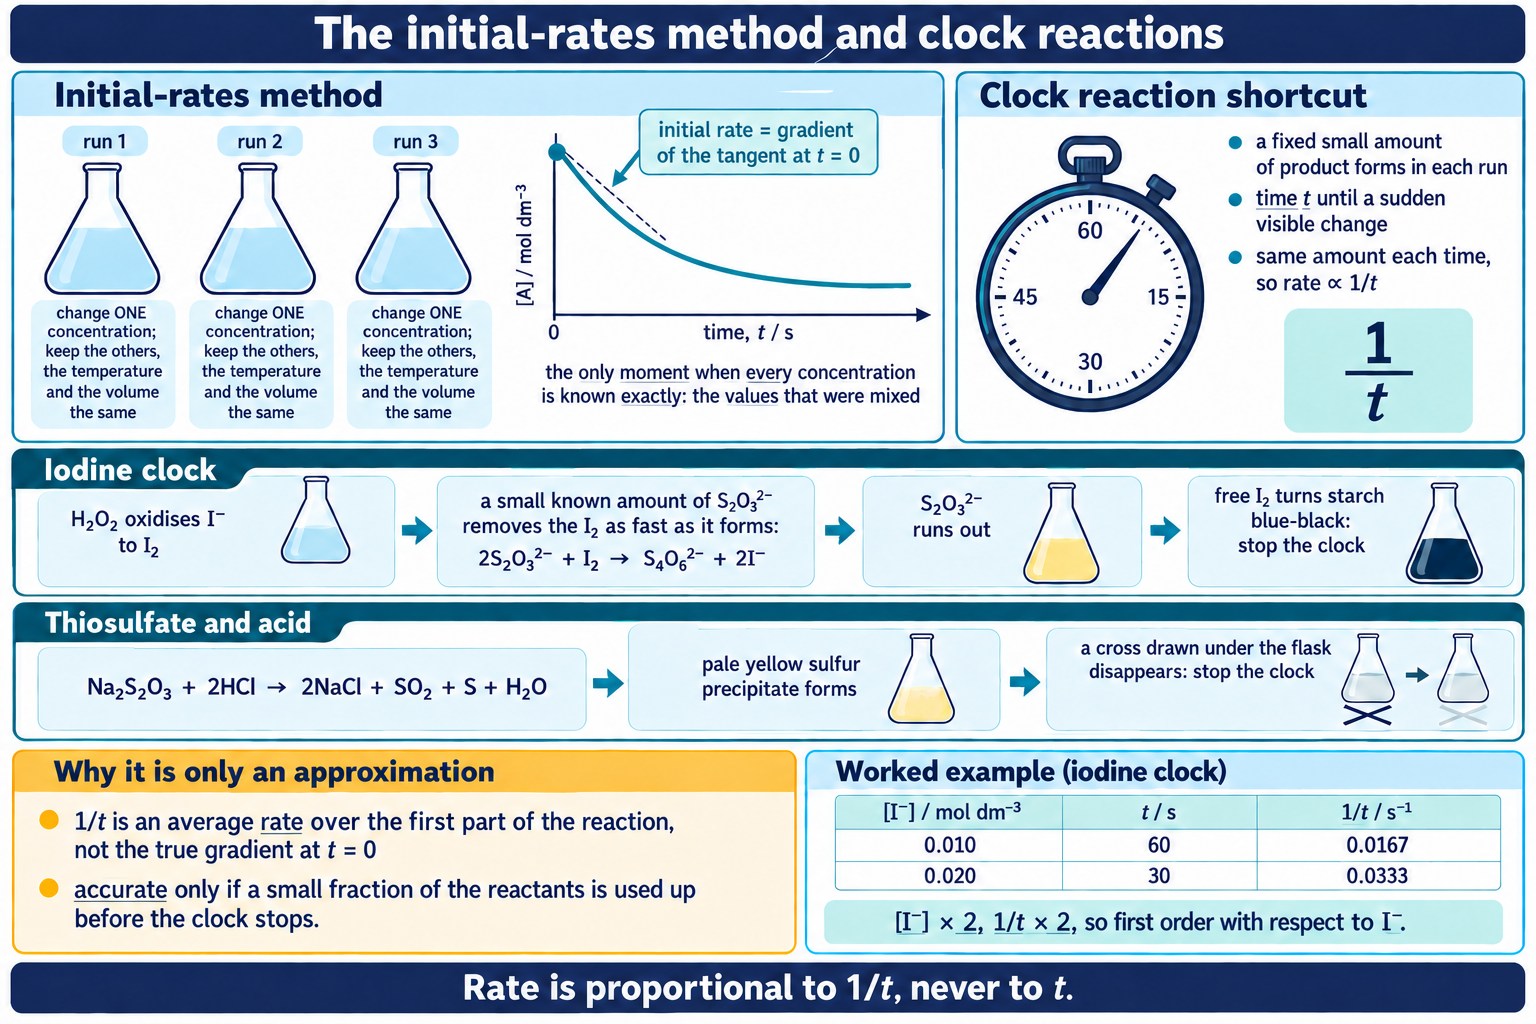
The initial-rates method compares separate runs at t = 0, and a clock reaction stands in for the tangent because the rate is proportional to 1/t.
Check: Continuous or Initial Rate?
Decide which method a description is using, and why, for experiments not described on this page.
Sampling, Quenching and Titration
Titration cannot be done on a reacting mixture, because the concentration would keep changing during the titration itself. Instead a sample is withdrawn with a pipette at a known time and the reaction in it is stopped at once: this is quenching.
There are three common ways of quenching. The first is to run the sample into a large volume of ice-cold water, which dilutes the reactants and cools them so that the rate falls almost to zero.
The second is to add a reagent that removes a catalyst or a reactant, such as sodium hydrogencarbonate solution to neutralise an acid catalyst. The third is simply to cool the sample rapidly in an ice bath.
Remember: The time of quenching, not the time of titration, is the time recorded.
The quenched sample is then titrated to find the concentration of one species.
Iodine is titrated with sodium thiosulfate solution using starch as the indicator near the end point; an acid formed or consumed in the reaction is titrated with a standard alkali.
Repeating at intervals, for example every 2 minutes, gives concentrations at known times for a concentration–time graph.
Exam focus: Quenching stops the reaction in the sample so that the concentration measured is the concentration at the time the sample was taken. Give the method (ice-cold water, sodium hydrogencarbonate) and the reason.
Common Exam Points
Say
“The other reactant is in large excess, so its concentration is effectively constant.” “The initial rate is the gradient of the tangent at t = 0.”
“Rate is proportional to 1/t because the same amount of product forms in each run.” “The sample is quenched with ice-cold water to stop the reaction before titrating.”
Do not say
“Time is the rate” (rate ∝ 1/t, not t). “Measure the gas with a colorimeter.” “Titrate the reaction mixture” (titrate a quenched sample).
Watch for
Justify questions: name the technique, name the property that changes, and say why the alternative would not work. Clock questions: state that the method assumes the concentrations have hardly changed by the time the clock stops.
Check: Quenching and Clock Reactions
Explain how a quench works and how a clock reaction gives a rate for experiments not used above.
FAQs
Use these quick answers to check the choice of technique.
What is quenching and why is it needed?
Quenching stops the reaction in a sample so that it can be titrated at leisure. It works by removing a reactant or catalyst, for example adding sodium hydrogencarbonate to neutralise an acid catalyst, or by cooling the sample in ice. Without it the composition would keep changing during the titration.
When can I use a colorimeter?
When one substance in the mixture is coloured and the others are not, such as iodine or bromine being used up. The colorimeter reads absorbance continuously, so you get a concentration–time curve without taking samples.
What is the difference between continuous monitoring and the initial-rates method?
Continuous monitoring follows one reaction mixture over time and gives a concentration–time graph. The initial-rates method uses several separate mixtures with different starting concentrations and measures the rate at the start of each, giving a rate–concentration relationship directly.
Why does a clock reaction give the initial rate?
The time measured is for a small, fixed amount of product to form, during which the reactant concentrations have hardly changed. Rate is then proportional to 1/t and is a good approximation to the initial rate.
Why must the temperature be kept constant during a rate experiment?
Because the rate constant depends on temperature. A run that warms up as it proceeds would give a curve that is a mixture of the concentration effect and the temperature effect, so the order deduced from it would be wrong.
Copyright and author footprint: This OLS revision page was written for Online Learning System by Dr. Mohammed Al-Fatah. It is designed for A Level Chemistry revision and should not be copied or redistributed without permission.
Keep this note — free
Save your progress across every AQA topic. A free account remembers which topics you have covered, saves your question scores, and syncs across your phone and laptop.
- Track every topic you have finished
- Keep your practice-question scores
- No payment, no card, free forever
Already registered? Log in