Concentration–Time Graphs and Half-Life
A concise revision guide to reading concentration–time graphs: the shapes for zero, first and second order, rate from a tangent, the constant half-life that identifies a first-order reaction.
- 3.1.9.2ii
What these spec points say
- 3.1.9.2ii use concentration-time graphs to deduce the rate of a reaction
Rate From a Concentration–Time Graph
When the concentration of a reactant is plotted against time, the gradient of the curve at any point is the rate of reaction at that moment.
The curve is steepest at the start, because the reactant is most concentrated. It flattens as the reactant is used up until the gradient is zero and the reaction has stopped.
The rate at a particular time is found by drawing a tangent to the curve at that time and calculating its gradient: the change in concentration divided by the change in time along the tangent.
The tangent at t = 0 gives the initial rate, the largest rate the reaction has.
The gradient of a falling concentration curve is negative, but the rate is quoted as a positive number.
If a tangent drops by 0.060 mol dm⁻³ over 75 s, the rate is 0.060 ÷ 75 = 8.0 × 10⁻⁴ mol dm⁻³ s⁻¹.
The same method works for a volume–time or mass–time graph from a gas experiment, in which case the rate has units such as cm³ s⁻¹ or g s⁻¹.
Exam focus: Draw the tangent with a ruler so it touches the curve at one point only, make it long, mark the triangle used, and quote the gradient with the correct units for the axes.
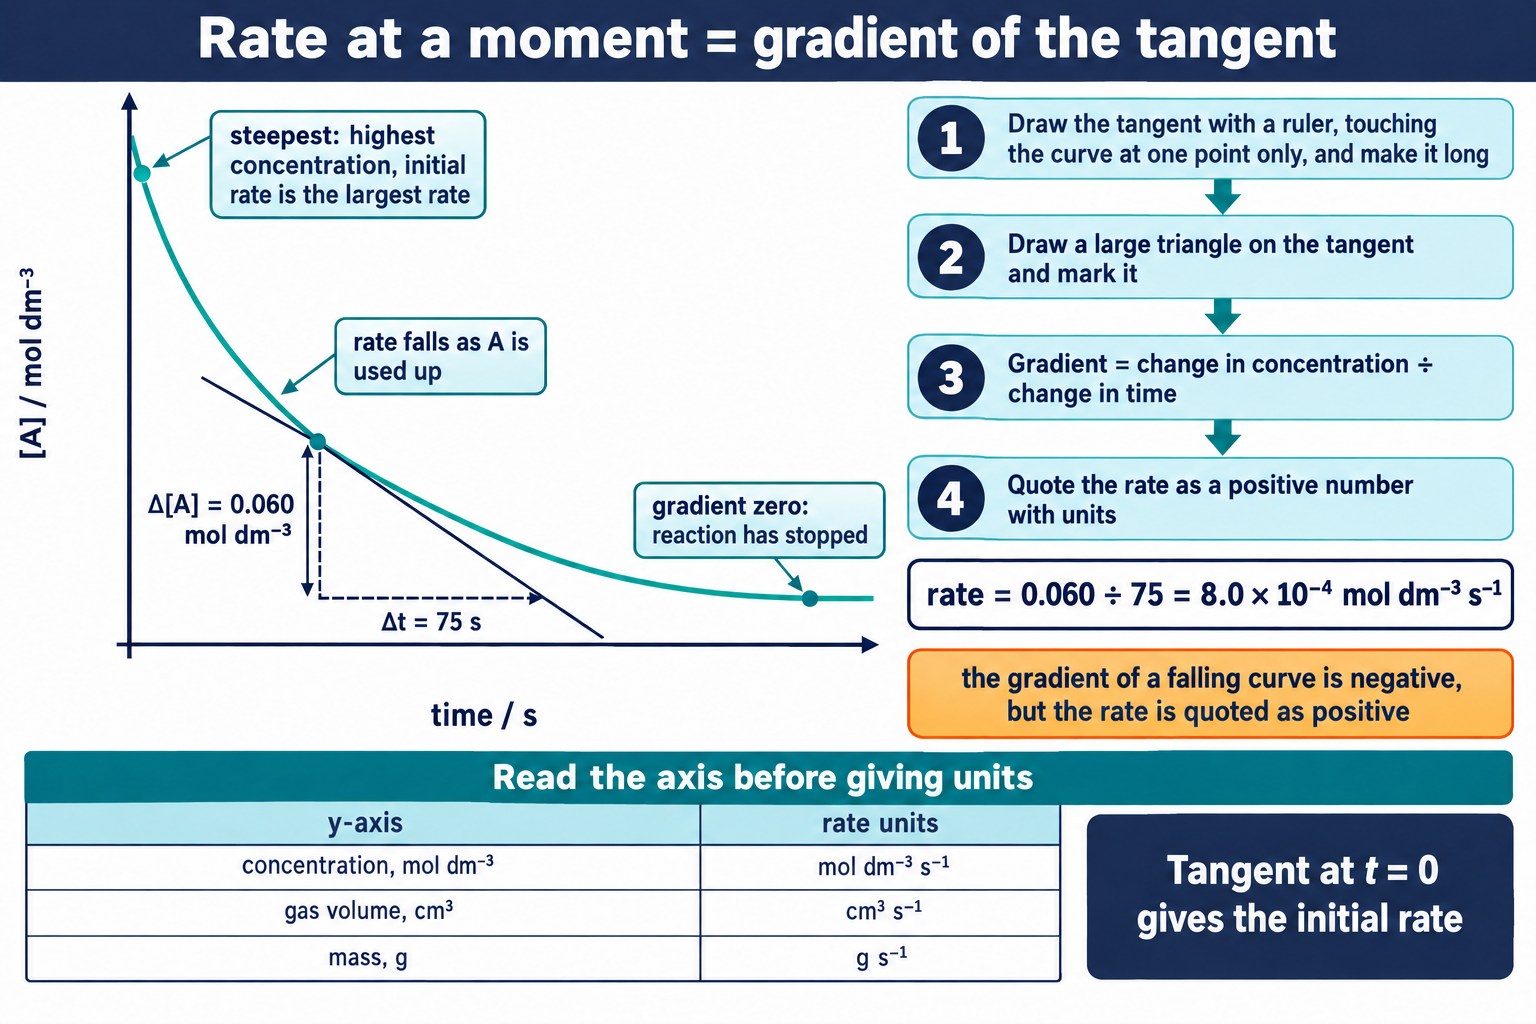
The rate at any moment is the gradient of a long ruler-drawn tangent, quoted as a positive number with the units of the axes.
Reading the Order From the Shape
The shape of a concentration–time graph shows the order with respect to the reactant being followed, provided that any other reactants are in large excess.
| Order | Shape of graph | Why |
|---|---|---|
| A zero-order reactant | Gives a straight line falling at a constant gradient | The rate does not depend on the concentration, so it does not slow down as the reactant is used up, and the gradient of the line is −k. |
| A first-order reactant | Gives a curve that falls ever more slowly, an exponential decay | Because the rate is proportional to the concentration and halves every time the concentration halves. |
| A second-order reactant | Gives a curve that starts steeper and flattens more sharply, then trails away in a long tail | Because the rate falls with the square of the concentration. |
The first-order and second-order curves both bend, and telling them apart by eye is unreliable. The test that separates them is the half-life, which is the subject of the next card.
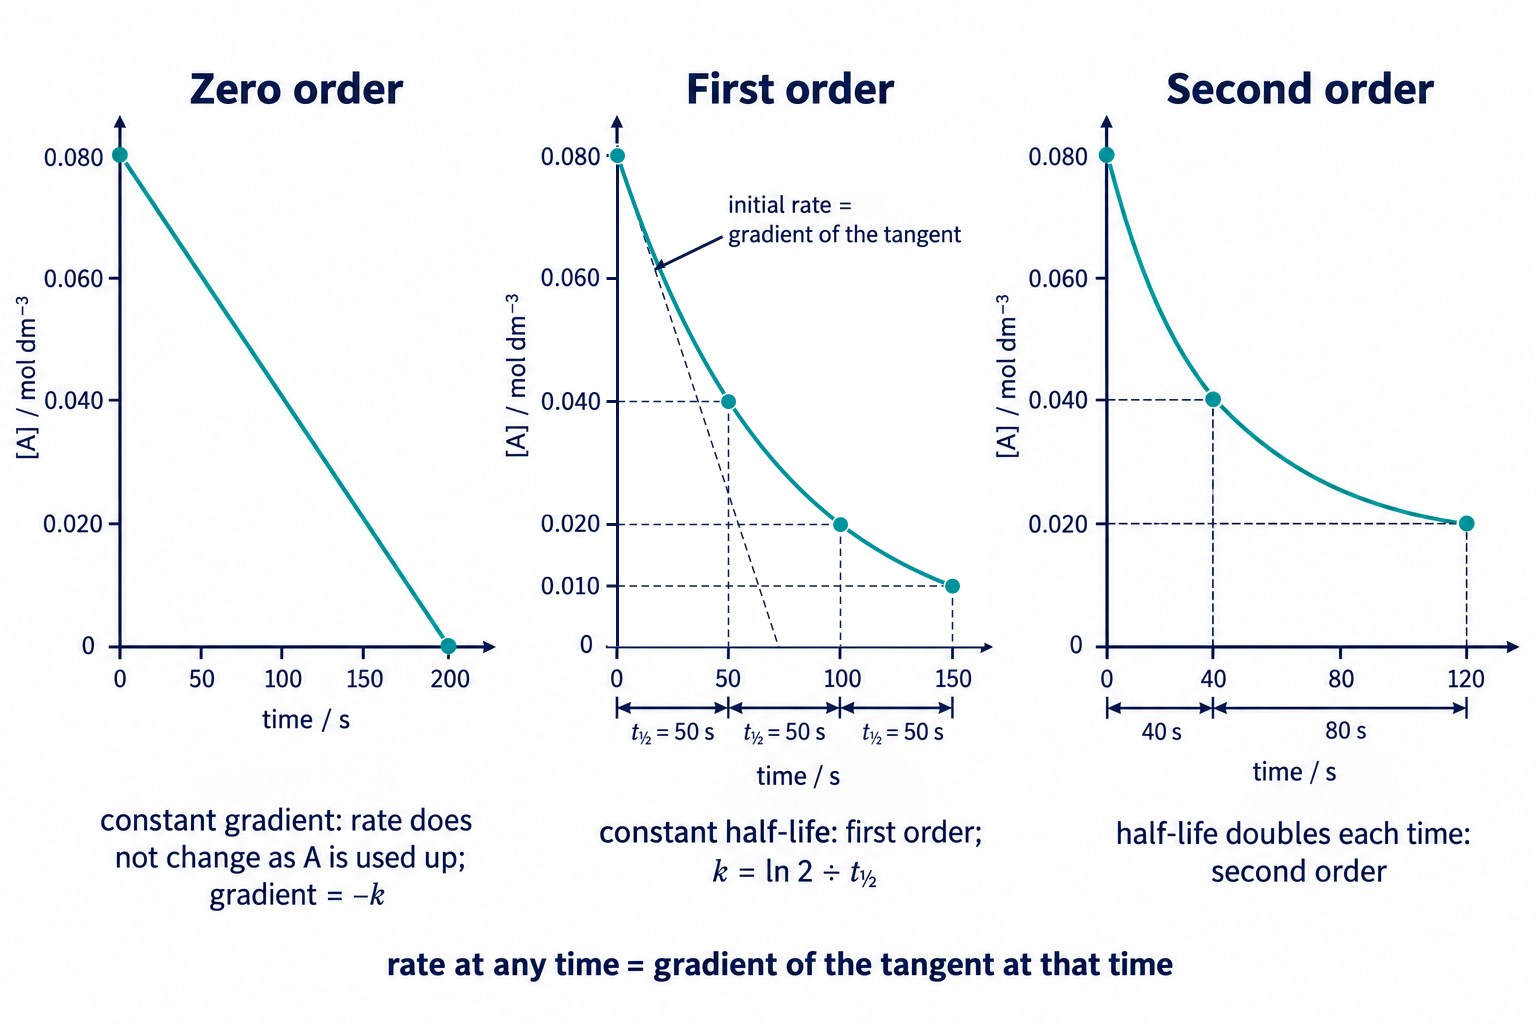
Concentration–time curves for zero, first and second order, with the tangent at t = 0 and the successive constant half-lives of the first-order curve.
Key idea: Straight line: zero order. Curve with a constant half-life: first order. Curve whose half-life keeps doubling: second order.
Check: Shape to Order
Deduce the order from the shape of concentration–time graphs for reactions not drawn on this page.
Half-Life
The half-life, t½, of a reactant is the time taken for its concentration to fall to half of its value.
It is read from a concentration–time graph by picking a concentration, finding the time at which the concentration has halved, and then repeating from that point.
On the graph above the concentration falls from 0.080 mol dm⁻³ to 0.040 mol dm⁻³ in 50 s, from 0.040 to 0.020 mol dm⁻³ in the next 50 s, and from 0.020 to 0.010 mol dm⁻³ in a further 50 s.
Every half-life is the same, 50 s, however far the reaction has gone.
A constant half-life, independent of the concentration, is the signature of a first-order reaction. Measuring two or three successive half-lives from a graph is the standard way to prove first order.
The other orders behave differently. For a second-order reactant each half-life is double the previous one (40 s, then 80 s, then 160 s), because the rate falls away faster than the concentration does.
For a zero-order reactant each half-life halves, because the rate stays the same while there is half as much to remove.
Half-lives can also be read from a volume–time graph of a gas experiment, using the volume of gas still to be produced, or from a table of concentration against time without a graph. The same rule applies: constant half-life means first order.
Definition: The half-life of a reaction is the time taken for the concentration of a reactant to fall to half its initial value. For a first-order reaction the half-life is constant, whatever the starting concentration.
Check: Half-Life From Data
Measure successive half-lives from data and decide the order for reactions not used above.
k From the Half-Life
For a first-order reaction the half-life and the rate constant are linked by a simple relationship, k = ln 2 ÷ t½, which is the same as k = 0.693 ÷ t½.
The specification does not require this equation, but it is a useful extra: it shows why a constant half-life means a constant k, and it lets you check a value of k found another way.
Because k is the same throughout a first-order reaction and the concentration does not appear in the equation, the half-life must be constant. This is the algebraic reason behind the graphical test.
On the graph above t½ = 50 s, so k = 0.693 ÷ 50 = 0.0139 s⁻¹, or 1.4 × 10⁻² s⁻¹ to two significant figures. The unit is s⁻¹ because the half-life is in seconds and the reaction is first order overall; a half-life in minutes gives k in min⁻¹, so convert to seconds if the question wants s⁻¹.
Worked example: A first-order reaction has k = 3.5 × 10⁻³ s⁻¹. Its half-life is t½ = 0.693 ÷ (3.5 × 10⁻³) = 198 s, about 200 s, and every successive half-life will be the same.
Common Exam Points
Say
“The half-life is constant, so the reaction is first order with respect to the reactant.” “The rate at that time is the gradient of the tangent to the curve.” “The straight line shows the rate is independent of concentration, so zero order.”
Do not say
“The graph is a curve, so it is first order” (second order also curves: measure the half-lives). “The rate is the concentration divided by the time” (that is an average over the whole run, not the rate at a time).
Watch for
Read the axis units before giving a rate: mol dm⁻³ s⁻¹ from a concentration axis, cm³ s⁻¹ from a gas volume. When measuring a half-life, start from any convenient concentration, not only the initial one, and show the readings you used on the graph.
Check: Tangents, Units and k
Calculate rates from tangents with the right units for graphs not shown on this page.
FAQs
Use these quick answers to check the concentration–time graph skills.
How do I tell first order from second order when both curves look similar?
Measure successive half-lives. A first-order curve has a constant half-life, so the time for [A] to halve is the same wherever you start. For second order each half-life is longer than the one before, and for zero order the graph is a straight line.
Why is the gradient of a concentration–time graph negative?
Because the reactant concentration falls with time, so the change in concentration is negative. Rate is quoted as a positive number, so you take the magnitude of the gradient of the tangent.
Why is it best to take at least two half-lives?
One half-life on its own tells you nothing about order. Two or three that come out about the same, say 45 s, 46 s and 44 s, are the evidence that the reaction is first order.
Does the half-life depend on the starting concentration?
For a first-order reaction, no. The half-life is the same whether you start at 0.5 mol dm⁻³ or 0.05 mol dm⁻³; that independence is what makes it useful. For other orders it does depend on the starting concentration.
Can I get k from a concentration–time graph?
Yes. Draw a tangent, work out the rate from its gradient, read the concentration at that point and put both into the rate equation, once you know the order. A tangent at two or three points gives a check that k comes out the same each time.
Copyright and author footprint: This OLS revision page was written for Online Learning System by Dr. Mohammed Al-Fatah. It is designed for A Level Chemistry revision and should not be copied or redistributed without permission.
Keep this note — free
Save your progress across every AQA topic. A free account remembers which topics you have covered, saves your question scores, and syncs across your phone and laptop.
- Track every topic you have finished
- Keep your practice-question scores
- No payment, no card, free forever
Already registered? Log in