The Maxwell–Boltzmann Distribution
A concise revision guide to the Maxwell–Boltzmann distribution: its shape and labels, the activation energy on the curve, why a small rise in temperature gives a large rise in rate, and how a catalyst changes the fraction of molecules able to react.
- 3.1.5.2i
- 3.1.5.2ii
- 3.1.5.3iii
- 3.1.5.5iii
What these spec points say
- 3.1.5.2i understand the Maxwell-Boltzmann distribution of molecular energies in gases
- 3.1.5.2ii draw and interpret Maxwell-Boltzmann distribution curves for different temperatures
- 3.1.5.3iii use the Maxwell-Boltzmann distribution to explain why a small temperature increase can lead to a large increase in rate
- 3.1.5.5iii use a Maxwell-Boltzmann distribution to explain how a catalyst increases the rate of a reaction involving a gas
What the Maxwell–Boltzmann distribution Shows
In a gas or a solution at a given temperature, the particles do not all have the same energy.
Collisions constantly transfer energy between them, so at any instant some are moving slowly and a few are moving very fast.
The Maxwell–Boltzmann distribution is a graph of the number of molecules against their energy, and it shows how the energies are spread out.
The curve has a characteristic shape. It starts at the origin, because no molecule has zero energy, and it rises to a peak at the most probable energy.
It falls away to the right in a long tail that gets closer and closer to the axis without ever touching it, because there is no upper limit to the energy a molecule could have.
The area under the curve is the total number of molecules.
The activation energy, Eₐ, is marked as a vertical line well to the right of the peak. Only the molecules in the shaded area beyond that line have enough energy to react when they collide.
For most reactions at room temperature that is a small fraction of the total, which is why most collisions are not effective.
Sketching rule: Start at the origin, peak, then a tail that approaches the axis but never meets it. Label the axes “number of molecules” and “energy”, and mark Eₐ to the right of the peak.
Check: Reading the Curve
Questions on the shape and labels of the distribution.
The Effect of Temperature
When the temperature rises, the average energy of the molecules rises, so the whole curve shifts to the right.
The peak moves to a higher energy and becomes lower, because the same number of molecules is now spread over a wider range of energies.
The area under the curve is unchanged: heating does not create molecules.
The important change is at the activation energy line. Because the tail of the higher-temperature curve is higher, the shaded area beyond Eₐ is much larger.
A much greater proportion of molecules has energy greater than or equal to Eₐ. This is why a small rise in temperature produces a large rise in rate.
The collision frequency rises only slightly, but the fraction of collisions that are effective rises a great deal.
Exam wording: For a temperature rise, give both points: “the peak moves to a higher energy and is lower” and “a greater proportion of molecules have energy ≥ Eₐ, so a greater proportion of collisions are successful and the rate increases”. The activation energy itself does not move.
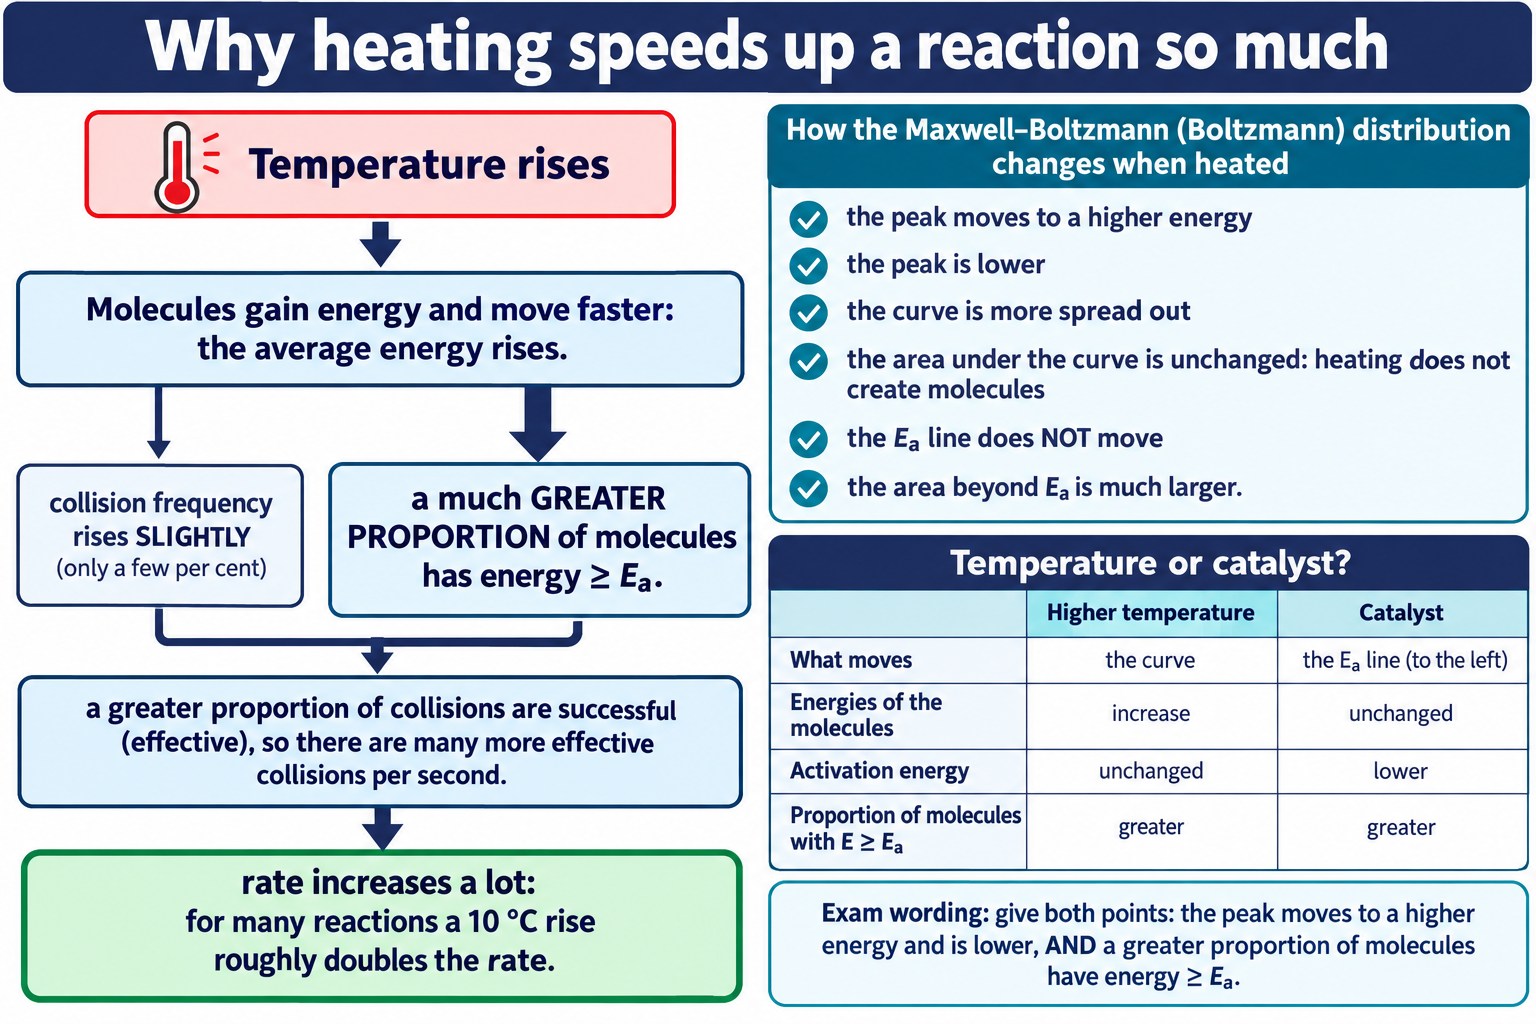
Heating raises the collision frequency only slightly but greatly increases the proportion of molecules with energy at least equal to the activation energy, which is why a small temperature rise gives a large rise in rate.
Check: Temperature and the Distribution
Explain temperature effects for a reaction not discussed above.
The Effect of a Catalyst
A catalyst does not change the energies of the molecules, so the curve stays exactly where it is.
Instead the catalyst provides a different route for the reaction with a lower activation energy, so the Eₐ line moves to the left.
A larger part of the same distribution now lies beyond the line. A greater proportion of the molecules already have enough energy to react by the catalysed route, so more collisions are effective and the rate increases.
The two effects are easy to confuse in an exam. Temperature moves the curve and leaves Eₐ where it is; a catalyst leaves the curve where it is and moves Eₐ.
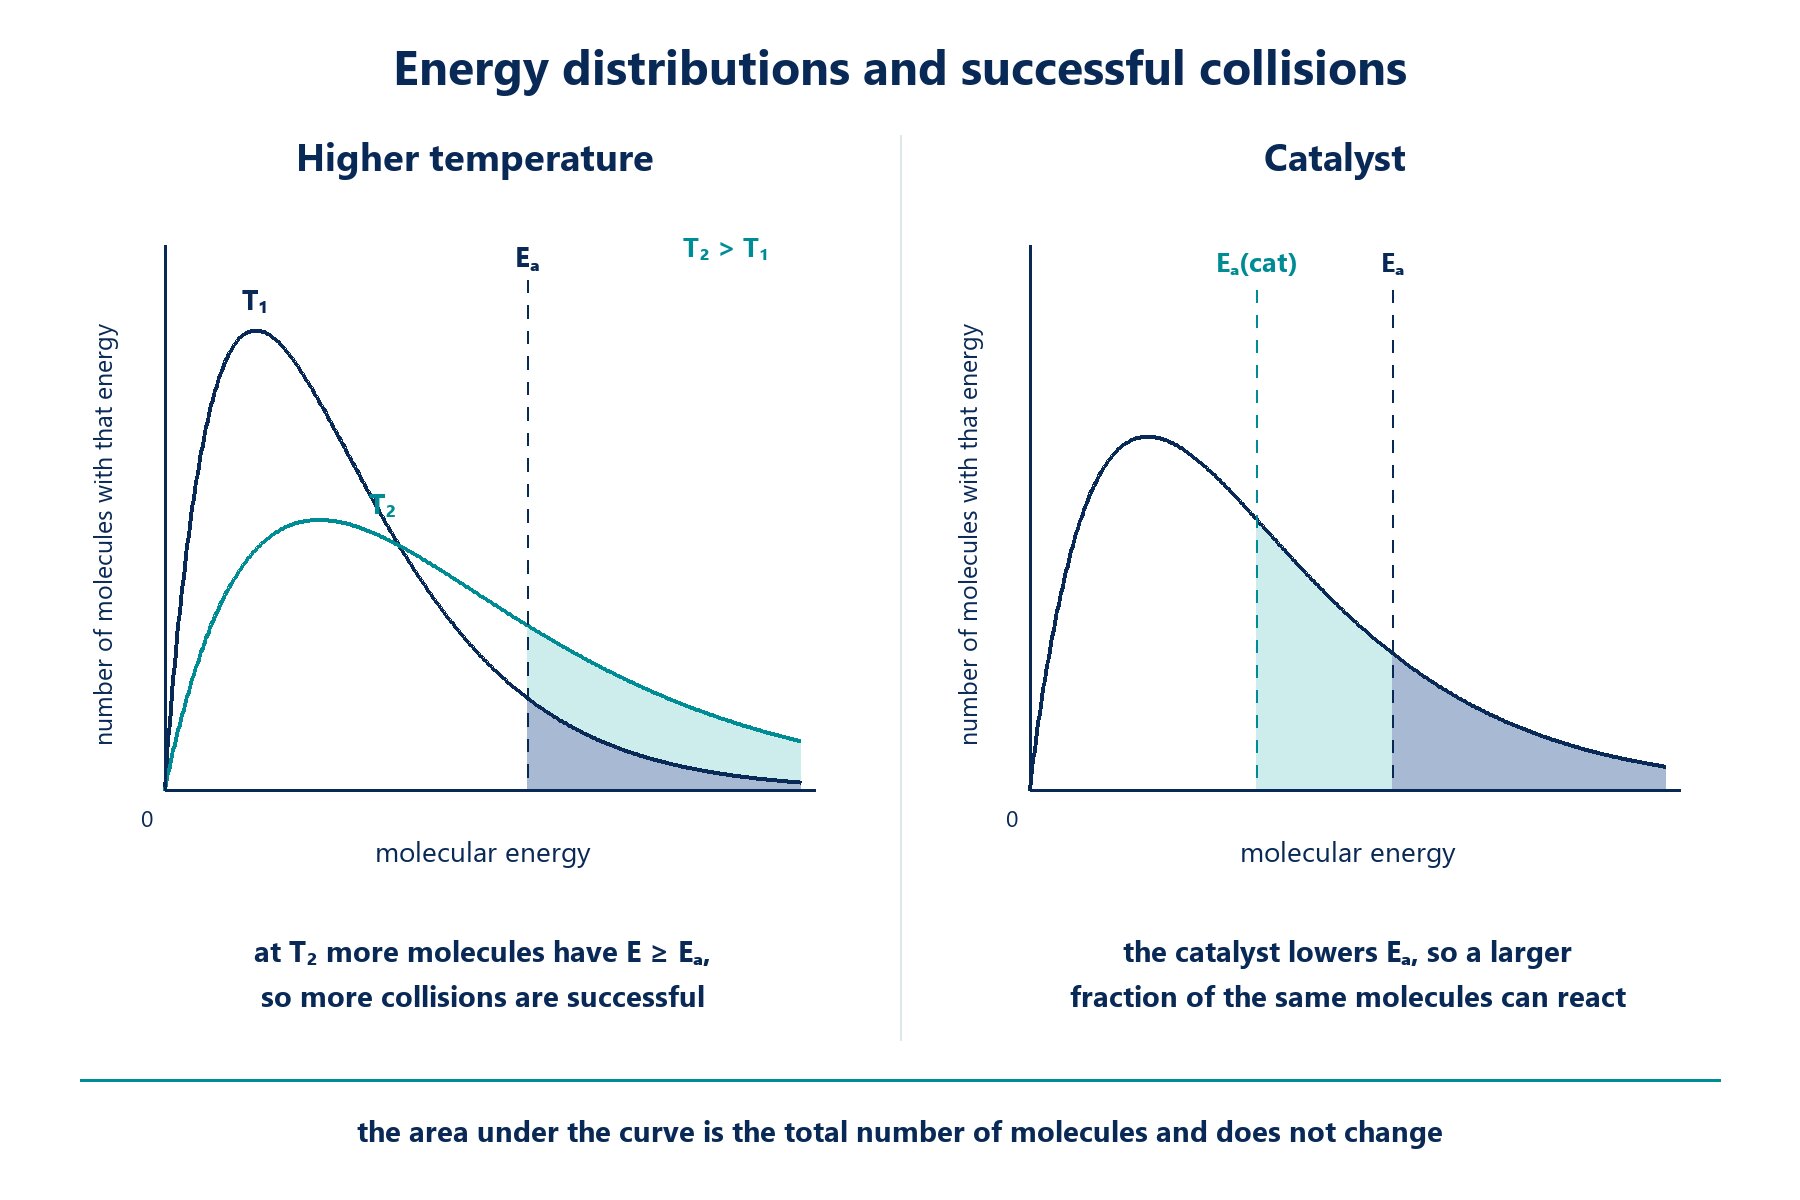
The Maxwell–Boltzmann distribution at two temperatures with the fraction beyond Eₐ shaded, and the same curve with the lower activation energy of a catalysed route.
Key idea: Temperature: the curve moves. Catalyst: the Eₐ line moves. Both increase the proportion of collisions with energy ≥ Eₐ.
Check: Catalyst or Temperature?
Decide which change is being described from the effect on the distribution.
FAQs
Use these quick answers to check the Maxwell–Boltzmann distribution.
Why does the curve start at the origin?
No molecule has zero energy, so the number of molecules with zero energy is zero.
Why does the curve never touch the axis at high energy?
There is no upper limit to the energy a molecule could have, so the number of molecules with very high energy approaches zero but never reaches it.
What happens to the area under the curve when the temperature rises?
Nothing. The area is the total number of molecules, which does not change. The curve becomes flatter and its peak moves to a higher energy.
Does heating lower the activation energy?
No. Heating moves the curve so that more molecules have energy above Eₐ; the value of Eₐ itself is fixed for a given route. Only a catalyst changes it.
What is the most probable energy?
The energy at the peak of the curve, the energy that more molecules have than any other. It is lower than the average energy because of the long tail.
Copyright and author footprint: This OLS revision page was written for Online Learning System by Dr. Mohammed Al-Fatah. It is designed for A Level Chemistry revision and should not be copied or redistributed without permission.
Keep this note — free
Save your progress across every AQA topic. A free account remembers which topics you have covered, saves your question scores, and syncs across your phone and laptop.
- Track every topic you have finished
- Keep your practice-question scores
- No payment, no card, free forever
Already registered? Log in