Measuring and Calculating Rates
A concise revision guide to following a reaction by mass loss, gas volume or time, rate from 1 ÷ time in clock reactions, and rate from the gradient of a tangent to a concentration–time curve, with the units of rate.
- 3.1.5.3i
- 3.1.9.2ii
What these spec points say
- 3.1.5.3i know the meaning of the term rate of reaction
- 3.1.9.2ii use concentration-time graphs to deduce the rate of a reaction
Following a Reaction
To measure a rate, something that changes as the reaction happens has to be followed over time. Which quantity is chosen depends on the reaction.
If a gas is given off, the loss in mass of the flask on a balance, or the volume of gas collected in a gas syringe, can be recorded every few seconds.
If a colour appears or disappears, the change can be timed or followed with a colorimeter. If a solid precipitate forms, the time for a cross to disappear under the flask gives a simple measure.
| Method | What is measured | Suitable for |
|---|---|---|
| Mass loss | Mass of flask and contents on a balance against time, with cotton wool in the neck to let the gas out | Reactions giving off a dense gas such as CO₂ (marble chips and acid) |
| Gas volume | Volume in a gas syringe or an inverted burette against time | Any gas, including H₂ (magnesium and acid) and O₂ (decomposition of hydrogen peroxide) |
| Time for a change | Time until a cross under the flask disappears, or until a colour appears | Precipitation of sulfur from sodium thiosulfate and acid; iodine clock reactions |
| Colour | Absorbance in a colorimeter, or titrating samples that have been quenched | Iodine and propanone; reactions of coloured ions |
A clock reaction is one where a sudden change, such as the appearance of a blue-black iodine–starch colour, marks the point when a fixed amount of product has formed. Because the same amount of product forms each time, the rate is proportional to 1 ÷ time.
Key idea: Whatever is followed, the rate at any moment is how fast that quantity is changing at that moment.
Rate from a Time: rate = 1 ÷ t
When the same amount of reaction is timed under different conditions, the average rate is proportional to 1 ÷ time.
In the sodium thiosulfate and hydrochloric acid reaction, Na₂S₂O₃ + 2HCl → 2NaCl + SO₂ + S + H₂O, the sulfur makes the mixture cloudy and the cross disappears when a fixed amount of sulfur has formed.
If the cross disappears in 40 s at one concentration and 20 s at double the concentration, the rate has doubled, because 1/20 is twice 1/40.
Plotting 1/t against concentration (or temperature) shows how the rate depends on that condition. This is an approximation, because 1/t does not have the units of a true rate, but it is exactly what is needed to compare runs.
Required practical 3 uses this approach to find how the rate depends on concentration or temperature.
Worked example: A clock reaction takes 84 s at 20 °C and 42 s at 30 °C. Rate ∝ 1/t, so the rate at 30 °C is (1/42) ÷ (1/84) = 2 times the rate at 20 °C: the usual “doubling for 10 °C”.
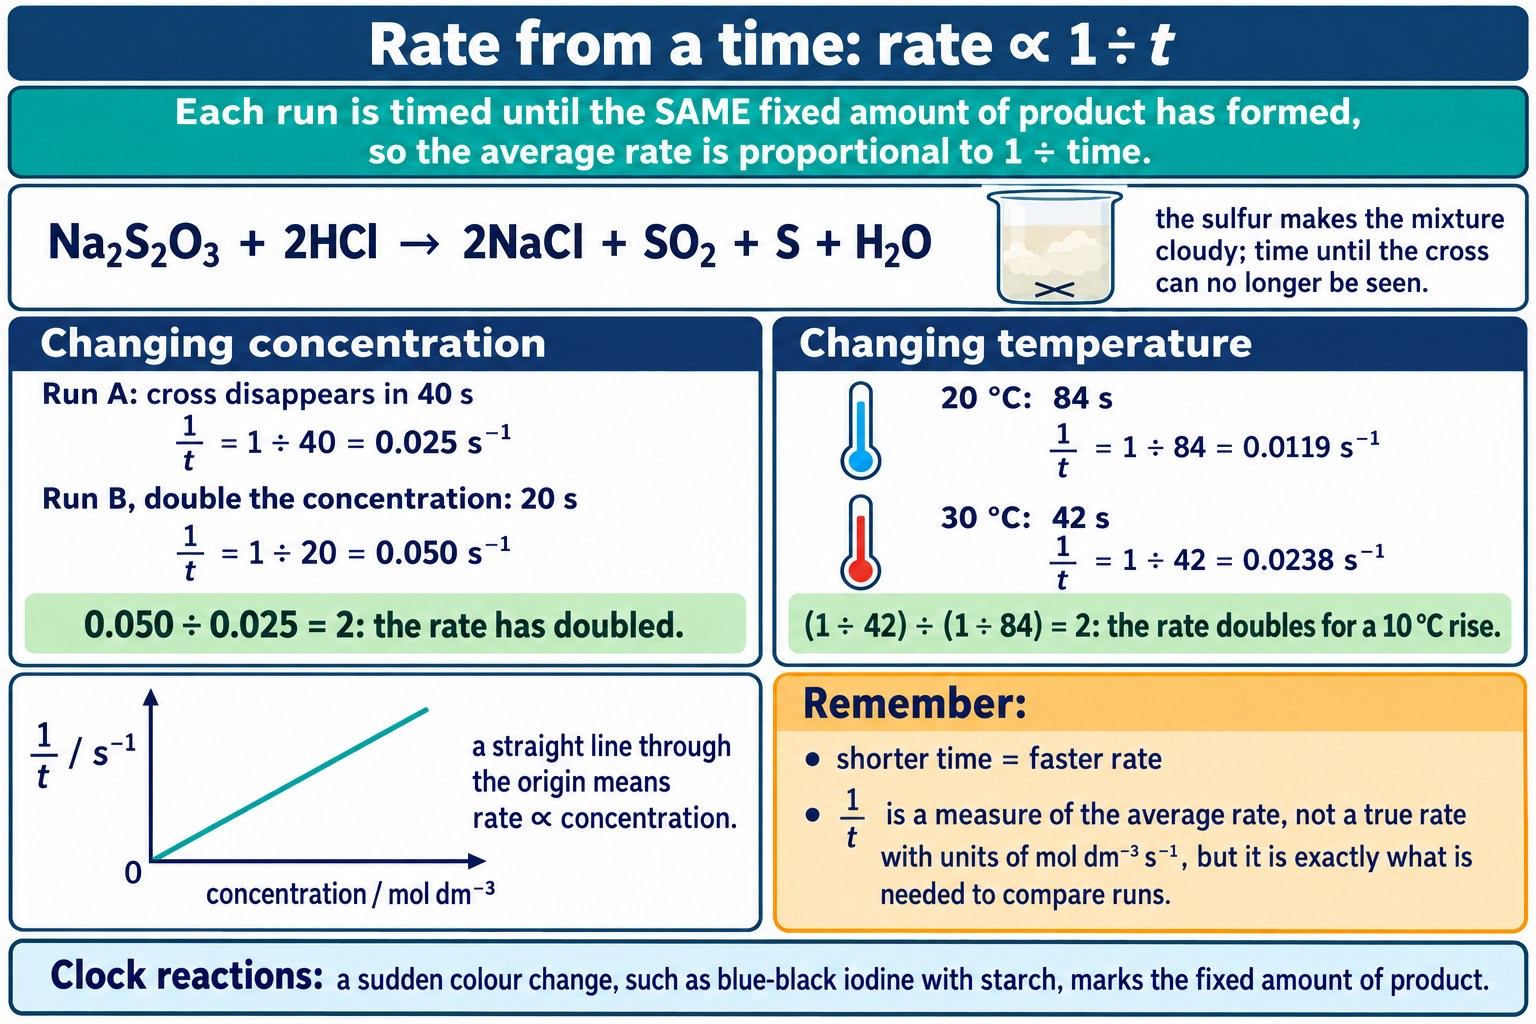
Because every run is timed to the same amount of product, 1 ÷ time compares the rates directly: halving the time doubles the rate.
Check: Rate from Time
Use rate ∝ 1/t on results that are not the ones above.
Rate from a Graph: the Gradient
When concentration (or volume, or mass) is plotted against time, the gradient of the curve at any point is the rate at that time.
The curve is steepest at the start, because the reactants are most concentrated, and flattens as they are used up until the gradient is zero and the reaction has finished.
To find the rate at a particular time, draw a tangent to the curve at that time and calculate its gradient: the change in the y quantity divided by the change in time over the length of the tangent.
The initial rate is the gradient of the tangent at t = 0, which is the largest value.
If concentration is on the y-axis the gradient has units of mol dm⁻³ s⁻¹; if gas volume is on it, cm³ s⁻¹.
Two curves for the same reaction under different conditions can be compared by their initial gradients. The same amount of reactant always gives the same final amount of product, so the curves level off at the same height, but the faster reaction gets there sooner.
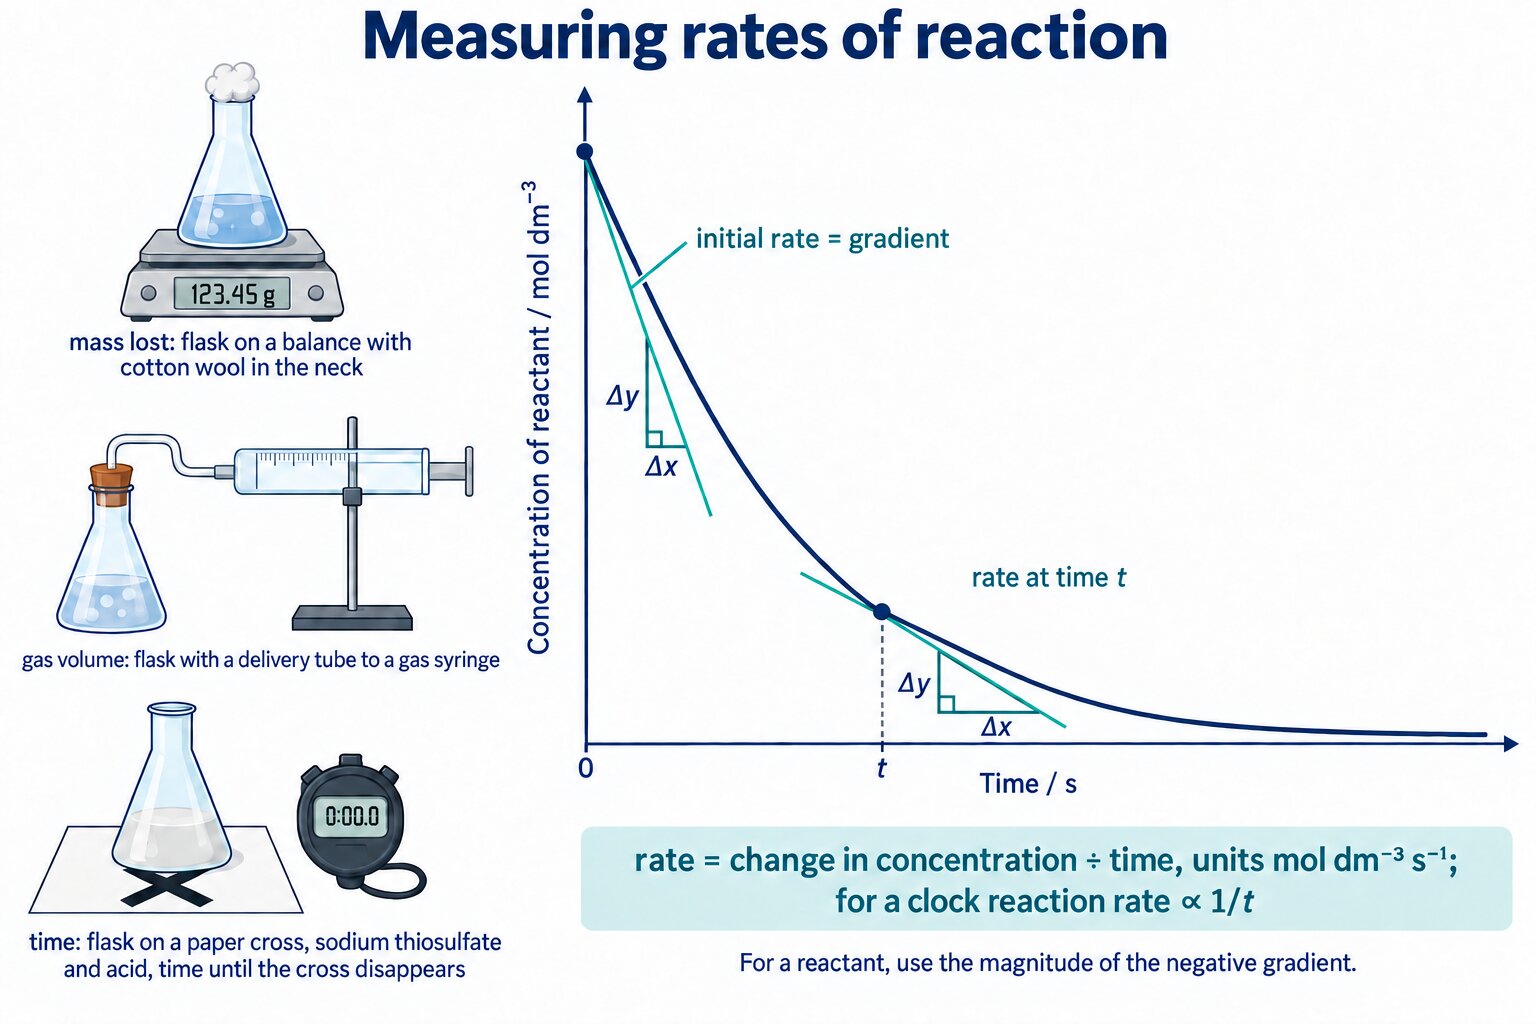
Three ways of following a reaction, and how the tangent to a concentration–time curve gives the initial rate and the rate at a later time.
Exam focus: Draw the tangent with a ruler so that it touches the curve at one point only, make it long, and show the triangle you used for the gradient. A tangent at t = 0 gives the initial rate.
Check: Gradients and Curves
Interpret rate graphs for reactions that are not on this page.
Common Exam Points
Say
“Rate = gradient of the tangent to the curve at that time.” “The initial rate is the gradient at t = 0.” “The curve levels off because the limiting reactant has been used up.”
Do not say
“The rate is the gradient of the line joining the start and the end” (that is an average rate, not the rate at a time). Do not read a gradient from a curve without drawing a tangent.
Watch for
Units: check what is on the y-axis before writing the unit of the rate. A volume–time graph gives cm³ s⁻¹, a concentration–time graph gives mol dm⁻³ s⁻¹.
Check: Units and Comparisons
Quick questions on the units of rate and on comparing two curves.
FAQs
Use these quick answers to check the measuring and graph skills.
Why is rate = 1/t only an approximation?
Because it measures the average rate over the time taken to form a fixed amount of product, and it has units of s⁻¹ rather than mol dm⁻³ s⁻¹. It is fine for comparing runs where the same amount of product forms.
Where is the reaction fastest on a concentration–time graph?
At the start, where the curve is steepest, because the reactant concentration is highest. The gradient falls as the reactant is used up.
How do I find the rate at a particular time?
Draw a tangent to the curve at that time and work out its gradient from a large triangle: change in the y quantity divided by change in time.
Why do two curves for different concentrations end at the same height?
If the same limiting amount of reactant is used, the same amount of product forms; the more concentrated run simply gets there sooner.
Why put cotton wool in the neck of the flask in the mass-loss method?
To let the gas escape but stop spray or liquid leaving, so the mass loss is the gas alone.
Copyright and author footprint: This OLS revision page was written for Online Learning System by Dr. Mohammed Al-Fatah. It is designed for A Level Chemistry revision and should not be copied or redistributed without permission.
Keep this note — free
Save your progress across every AQA topic. A free account remembers which topics you have covered, saves your question scores, and syncs across your phone and laptop.
- Track every topic you have finished
- Keep your practice-question scores
- No payment, no card, free forever
Already registered? Log in